[Reader Disclosure]Our content is reader-supported. This means we may earn a commission if you click on some of our links.
You may have a brilliant idea that inspires you to start a company or launch a new product. Or perhaps you’re just considering expanding your product line or recruiting more people. But, starting a business or continuing one is not all hunky-dory. In fact, it is always risky. Thus, it’s a good move to keep your risk to a minimum before diving in.
But, how can you assess whether your business plans make any financial sense or not? Because, in the end, the ultimate goal of every business is to make money. Or, how can you determine whether a possible investment would at least cover the costs connected with launching a new product or purchasing new equipment?
Well, conducting a break-even analysis is your go-to approach to understand when you can expect to start making a profit. In fact, it is an efficient financial measure for every entrepreneur or small business owner out there as it can provide them with information on whether they’ll need to borrow money to keep their business afloat or if their venture is even worth pursuing.
But, what is break-even analysis, though? Or what even is a break-even point?
Worry not. We’ve got you covered. Everything you need to know about break-even analysis, including how it works and its benefits and limitations, is right here.
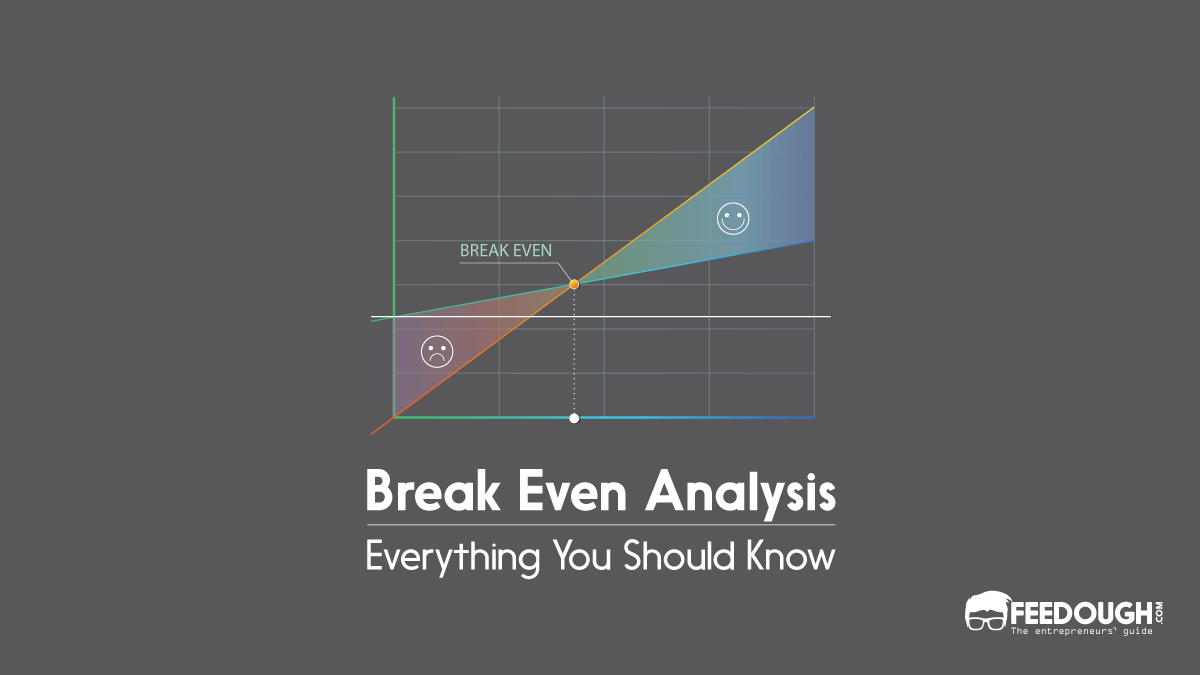
The Break-even point is the point at which total revenue is equal to the total cost. This implies that at the break-even point, your company is bringing in the same amount of money as you need to meet all of your costs. In other words, at the break-even point, all costs are paid, and there is no profit or loss.
Once you pass the break-even point, you gain money (profit); below break-even, you lose money (loss).
Thus, the break-even point determines the amount of sales necessary to cover total costs, including the company’s fixed and variable costs, in either unit (quantity) or revenue (sales) terms.
For example, XYZ Company spent $50,000 on manufacturing costs and received $50,000 in revenue. In this scenario, the company is at the break-even point, which implies it didn’t lose money but didn’t make any either.
What Is Break-Even Analysis?
Break-even analysis is an analytical approach for determining the level of output and sales volume at which a business ‘breaks even’, that is when revenues are adequate to cover all costs.
It is one of the most commonly used concepts in financial analysis which is not only limited to economic use, but is also used by entrepreneurs, accountants, financial planners, managers, and even marketers as it helps to determine the number of units or dollars of revenue required to cover all costs (fixed and variable costs). Hence, it is also known as “cost-volume-profit analysis”.
Also, the analysis is beneficial to all aspects of a business because it enables the staff to determine necessary outputs and strive toward achieving them. Most importantly, it’s a financial calculation that helps a business to address crucial questions such as:
What is the least amount of goods or services it needs to sell every month?
What price will bring those numbers into line with its break-even calculation?
What is the price at which it can make a decent profit?
What are the projected profits and losses at any given output level?
What is the bare minimum of sales required to avoid a loss?
What effect would raising or lowering prices have on your profit margins?
What impact will rising costs have on your break-even point?
When total costs (TC) equal total revenues (TR), you’ve reached break-even, or
TR = TC
Now, to proceed further, it is important to have a reasonable understanding of each element that goes into the calculation of the break-even point.
Fixed Cost: Any costs that stay unchanged regardless of how much product you sell are fixed costs. This includes rent, equipment costs, interest paid on capital, insurance, and labour.
Variable Cost: Variable costs are those costs that vary based on the amount of product you sell. This includes payment processing, hourly labour payroll costs, sales commissions, and raw material, utility, and shipping costs. The total variable cost (TVC) is computed by multiplying the unit variable cost (VC) by the number of units produced (n). For example, if producing one item costs $50, and you make 5 of them, then the total variable cost is $50 x 5 = $250. Thus,
TVC = n x VC
Now, Total cost (TC) is the sum of total fixed cost (TFC) and total variable cost: TC = TFC + (n x VC).
Total Revenue: Total revenue is the total amount of money earned by the company by selling its offerings during a period of time. The total revenue is calculated by multiplying the unit sales price by the number of units produced or sold: TR is equivalent to n x P, where P is the unit price. Thus,
TR = TC
n x P = TFC + TVC
n x P = TFC + n x VC
n x P - n x VC = TFC
(P - VC) n = TFC
Solving for n gives the number of units you need to break even:
n = TFC/(P – VC)
Let’s have a look at an example to get a better understanding of this calculation.
Company A sells and produces footballs and has a total fixed cost of $150,000. The variable cost of producing footballs is $20 per unit, with each football selling for $70. You can calculate Company A’s break-even point using the break-even point equation:
n = TFC/(P – VC)
= 150,000/ (70-20)
= 3,000
So, to break even, Company A would have to sell 3000 footballs.
Now, getting back to our calculation.
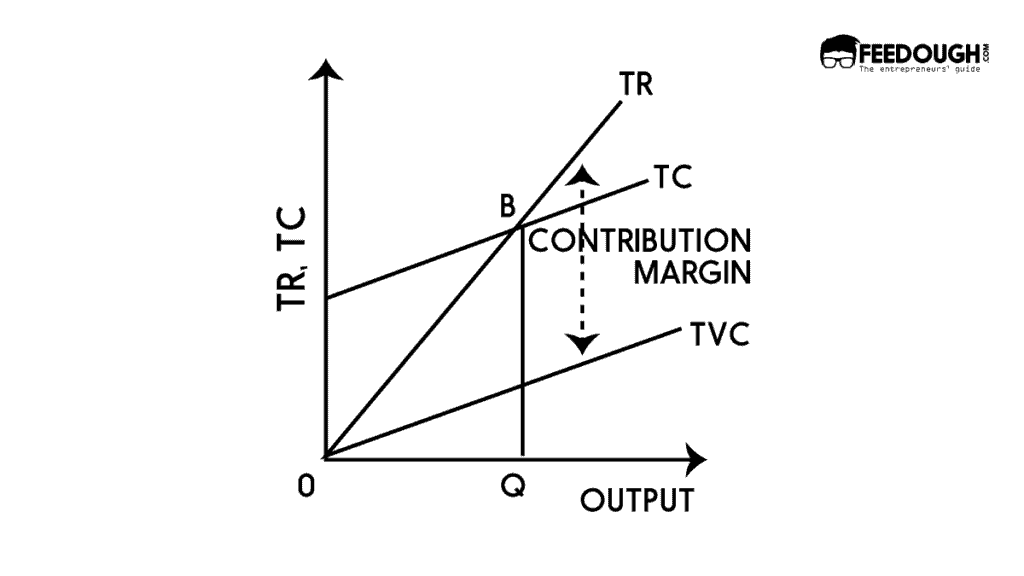
The figure (P – VC) is important and is known as the Unit Contribution Margin (C). It represents the marginal profit per unit, or alternatively, the part of each sale contributing to fixed costs. By definition, unit contribution margin is the difference between the product’s selling price and its total variable cost.
For instance, if a briefcase is sold for $100, the total fixed cost is $15,000, and the variable cost is $70 per unit, then the unit contribution margin is $30, and it helps to cover the fixed costs.
Thus, the break-even point can be calculated more easily as the point where:
Total Contribution = Total Fixed Cost
Unit Contribution x Number of Units = Total Fixed Cost
Number of units (n) = Total Fixed Cost (TFC)/ Unit Contribution (C)
Alternatively, the break-even point in terms of revenue (currency units, a.k.a. sales dollar) can be computed by dividing the total fixed costs by the contribution margin ratio. The contribution margin ratio is the contribution margin represented as a percentage of sales. It is calculated by dividing the unit contribution margin (C) by the sale price (P).
Break-even (in sales) = TFC/ C/P
For example, in the previous example of the briefcase, the contribution margin ratio is 30% ($30 contribution margin per item divided by $100 sale price per item). So, the break-even point in sales dollars is: $50,000 ($15,000 total fixed costs divided by 30% = $50,000)
The next step is plugging in your data in a spreadsheet and then converting the spreadsheet into a graph. This graph will help in computing the break-even points for each level of sales and product price.
Graphical Representation Of The Break-Even Point
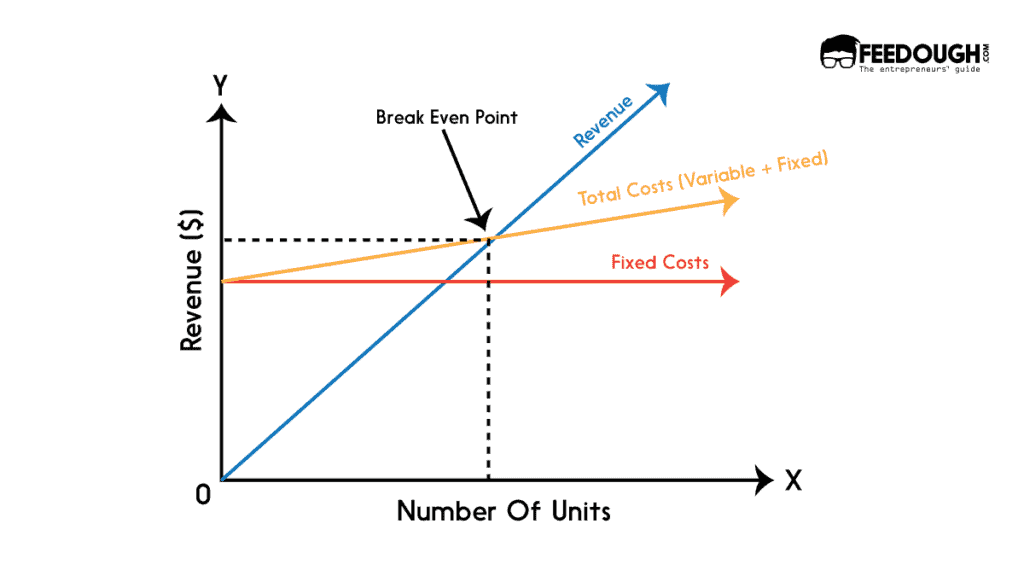
The break-even analysis can be represented graphically using a break-even chart. The break-even analysis chart shows the various costs incurred at different sales levels.
Explanation
The X-axis (horizontal) represents the number of units sold.
The Y-axis represents the sales revenue generated in dollars.
The red line represents the total fixed cost, showing that the costs are constant regardless of output level.
The Income line (blue line) depicts the amount of revenue generated as the number of units sold increases.
The yellow line is the total cost line (fixed and variable costs) that depicts how costs incurred by the business fluctuate as the number of units sold increases. Also, it is important to note that costs do not start at zero. These are the costs that are your fixed costs. Your costs start to rise as soon as you make your first sale (fixed costs + variable costs of selling one unit). Your costs will continue to rise as more units are sold. But they do not rise at as steep a rate as your revenue does when you sell more units.
The point on the diagram where the revenue and total cost curve intersect is the break-even point where total costs equal revenue, and the company neither makes a profit nor a loss. Thus, the break even point is often known as the “no-profit” or “no-loss” point.
When you sell more quantities of goods, your costs fall below your revenue, resulting in a profit. Here, the revenue curve lies above the total cost curve. Thus,
Profit when revenue> Total Variable cost + Total Fixed cost
When you sell more quantities of goods, your costs exceed your revenue, and you’re making a loss. Here, the total cost curve lies above the revenue curve. Thus,
Loss when revenue < Total Variable cost + Total Fixed cost
Now, it is important to note that no economic theory is complete without assumptions, making the complex theory simpler and easier to understand. Hence, the assumptions that underpin the break-even analysis are as follows:
The revenue and cost functions are both linear.
Variable costs vary proportionately with output.
The total costs are classified into fixed and variable costs. It ignores semi-variable costs.
The volume of sales and volume of the production are equal. It means that there is no opening or closing stock.
The sale price is constant.
There is no change in technology and productivity.
There is only one product. In the case of multiproduct, the product-mix remains constant.
Also, for your company to earn more profit, the break-even point must be lowered. Here are the most efficient methods for reducing it.
Increase product prices: If you increase the price of your product, you won’t need to sell as many units to break even. The marginal contribution will be greater per unit sold. But, also consider what the market is willing to pay. You won’t need to sell as many units, but you’ll still need to sell enough—and customers may demand a better product or better customer experience if you charge more.
Lower fixed costs: You’ll need to sell fewer units to break even if you can reduce your fixed costs. For instance, if you’re considering launching a retail business, but the numbers don’t add up, try selling online instead. By choosing this option, you are lowering your fixed cost of the rent. Also, you can go for outsourcing as it may enhance your company’s profitability by lowering manufacturing costs as production volume increases.
Why Does Your Business Need To Perform Break-Even Analysis?
A break-even analysis can help you determine the level of performance your company must achieve to avoid losing money. Thus, making it an important part of financial predictions for new or expanded product lines and businesses.
In addition to this, it assists you in figuring out how much seed money or startup capital you’ll need, as well as whether or not you’ll require a bank loan. Hence, there are several benefits of break-even analysis for your business as it helps in:
Assists in identifying the point of profitability: The objective of any business is to become profitable as quickly as possible. To make sure you’re on the right track, pay attention to your figures right away. You risk not making a profit if you don’t determine the break-even points for your products or services (or not as much of a profit as you believed you would). Once the break-even point is achieved, the break-even analysis aids in determining the company’s remaining/unused capacity.
Formulate a pricing strategy: Break-even analysis provides you with a far more solid foundation on which to price your items. Here, the selling price is a critical factor. Make use of the break-even charts to see the impact that changes in selling prices have on overall profitability. Also, periodically examine your present financial status to determine how patient you can be in order to achieve your break-even point.
Control and monitor costs: Even though your variable costs are subject to change, your fixed costs, like insurance or web development fees, must still be covered. You can do this by performing a break-even analysis. It is done by realising the direct impact of costs (both fixed and variable) on a company’s profitability, thus keeping the costs under control and within a certain range.
Set revenue targets: A break-even analysis may also be a useful tool for determining precise sales targets for your team. This is done by settling on revenue objectives that have a specific figure and a timeframe in mind.
Obtain funds: Break-even analysis is typically a critical component of company strategies when it comes to receiving funding. You’ll need to perform a break-even analysis if you want to obtain funding for your business or startup as you must demonstrate to the investors that your strategy is viable. Furthermore, the break-even point will make you more comfortable with the idea of taking on additional debt or financing.
Reduce risk: Some business concepts aren’t meant to be pursued. Break-even analysis can help you reduce risk by guiding you away from investments that are unlikely to be successful. Also, it will assist you in avoiding failures and limiting the financial impact of poor decisions on your company. On the brighter side, it will make you face reality about the potential outcomes.
Budget and Set Goals: Break-even charts and calculations should be utilised in the budgeting process since the company knows exactly how many units must be sold to break even. Furthermore, the firm is aware of the profits it will be able to generate at certain stages, which may be simply represented on a break-even chart.
Make better and smarter decisions: Any company strategy should include a break-even analysis. If you wish to take on investors or other debt to support your firm, it’s typically a necessity. You must demonstrate that your strategy is viable. Furthermore, if the analysis appears to be positive, you will feel more comfortable taking on the financial load.
Now that we have established the importance of break-even analysis. The next important question is: when do you need to do a break-even analysis? Let’s find out.
When To Use Break-Even Analysis?
Basically, each time a company contemplates adding costs, it should conduct a break-even analysis.
Thus, break-even analysis should be used to assess the risk and value of any business investment, particularly when one of the following situations occurs:
Starting a new business: Break-even analysis is a great tool to use when you’re starting a new business since it enables you to see if your idea is viable. It also supplies you with data that you may utilise to design your pricing strategy.
Expanding your business: According to Rob Stephens, founder of CFO Perspective, your business should use break-even analysis to determine how long it will take any planned investments or changes in your business to become profitable.
Creating a new product: When creating a new product, it’s also a good idea to perform a break-even analysis, especially if it’s a high-cost endeavour.
Lowering pricing: Firms may need to decrease their price approach to compete in a certain market sector or product. As a result, when decreasing prices, firms must determine how many more units they must sell to counterbalance or compensate for the price reduction.
Changing the business model: Finally, if you change your business model – such as introducing a new sales channel or adjusting your distribution strategy – your expenses might drastically change, so a break-even analysis is always a smart idea. When making business changes, there are many possibilities and what-ifs to consider, which makes choosing which scenario to pursue more difficult. Business executives will benefit from BEP’s ability to simplify decision-making to a series of yes or no questions.
Limitations Of Break-Even Analysis
Even though the break-even analysis is useful for making business decisions and more, the limitations of a break-even analysis should not be overlooked.
Data constraints: Since the break-even analysis is based on accounting data, it is subject to data limitations such as the omission of imputed costs, arbitrary depreciation estimates, and inaccurate overhead cost allocation.
Dependent on accurate data: The precision of your break-even analysis is determined by the accuracy of your data. You won’t obtain a trustworthy result if you don’t enter the correct data into the algorithm. Thus, break-even analysis may not be the most effective tool in your arsenal if your estimates are incorrect or you’re dealing with fluctuating costs.
Not a predictor of demand: It’s necessary to keep in mind that a break-even analysis isn’t a demand predictor. It is just a supply-side, that is, costs-only study, as it doesn’t tell you anything about how much the product will sell at these different prices or how many people will want to buy what you’re selling. The analysis only identifies how many units you need to sell to break even. It’s also worth noting that demand isn’t consistent. The number of people willing to buy your stuff will vary as your pricing changes.
Ignores elasticity of demand: The elasticity of demand is an economic measure that denotes the responsiveness of quantity demanded to a change in one of its determinants. These determinants are price, income, and preference, which affect the quantity demanded of a good or service. The demand for a good is said to be elastic if the quantity demanded responds substantially to changes in one of the determinants. As far as the break-even analysis is concerned, it completely ignores the concept of elasticity of demand and the prospect that varied prices or other variables will result in varying levels of quantity demanded.
Ignores the competition: Another drawback of break-even analysis is that your competitors aren’t taken into account. The knowledge about the new entrants to the market is crucial as they have an impact on the demand for your items. Their development in the market can even force you to adjust your prices, affecting your break-even point, that’s how much influence they have on your business.
Too simplistic: The formula for calculating the break-even point is straightforward. Many firms sell a variety of items at different rates. That subtlety is difficult to incorporate in the break-even formula. For that, you’ll have to deal with one product at a time or make an average pricing estimate based on all the items you’ll be selling.
Limited products: The break-even analysis is based on limited products and a small geographic area. Today’s business produces a wide range of products and operates several departments or facilities, all of which cannot be grouped together and shown on a single break-even chart. As a result, the scope of this analysis is confined to a single product of a particular business.
Short-Run Analysis: The break-even analysis is only useful in the short term, but it is not quite an effective tool for the long-term. Like in the case of fixed costs, your fixed costs remain the same over the short term. They could, however, vary over the long run. For instance, if your company grows and you decide to move to a larger office and hire more workers, your rent and salary bill will go up. In such a case, our break-even calculation gets befuddled. So, usually the break-even analysis is employed in the early phases of decision-making for this and other reasons.
Due to such limitations, the break-even analysis has fallen out of favour with financial experts in recent years. It’s perfectly acceptable when performed correctly, and it may be beneficial, but it’s not appropriate for all organisations or situations.
So, the financial experts recommend incorporating a break-even analysis together with other profitability indicators like net profit margin to get the most accurate picture of your business’s financial health.
Go On, Tell Us What You Think!
Did we miss something? Come on! Tell us what you think about our article on break-even analysis in the comments section.
An avid reader and economics enthusiast who is always eager to learn. Prachi is an aspiring leader who believes in what she does. Besides reading , she is fond of baking , dancing and travelling.
Each week I share research backed AI oriented content in my newsletter.
There are AI ideas, AI trends, tutorials, and guides.
24k entrepreneurs read it. I'd love you to join.


: Detailed Guide")

: Detailed Guide")