It’s essential to find the right balance of inventory in your business. Too little can cause problems, but too much can result in wasted resources and potential damage due to fluctuating demand. However, when you effectively manage your inventory, it ensures a seamless flow of goods, from sourcing raw materials all the way to selling finished products.
And it’s not just you; many mammoth companies have suffered significant financial losses due to mismanaging their inventories. Ineffective inventory management can result in higher storage costs, working capital crunch, wastage of labour resources, increased idle time, and disruptions in the supply chain.
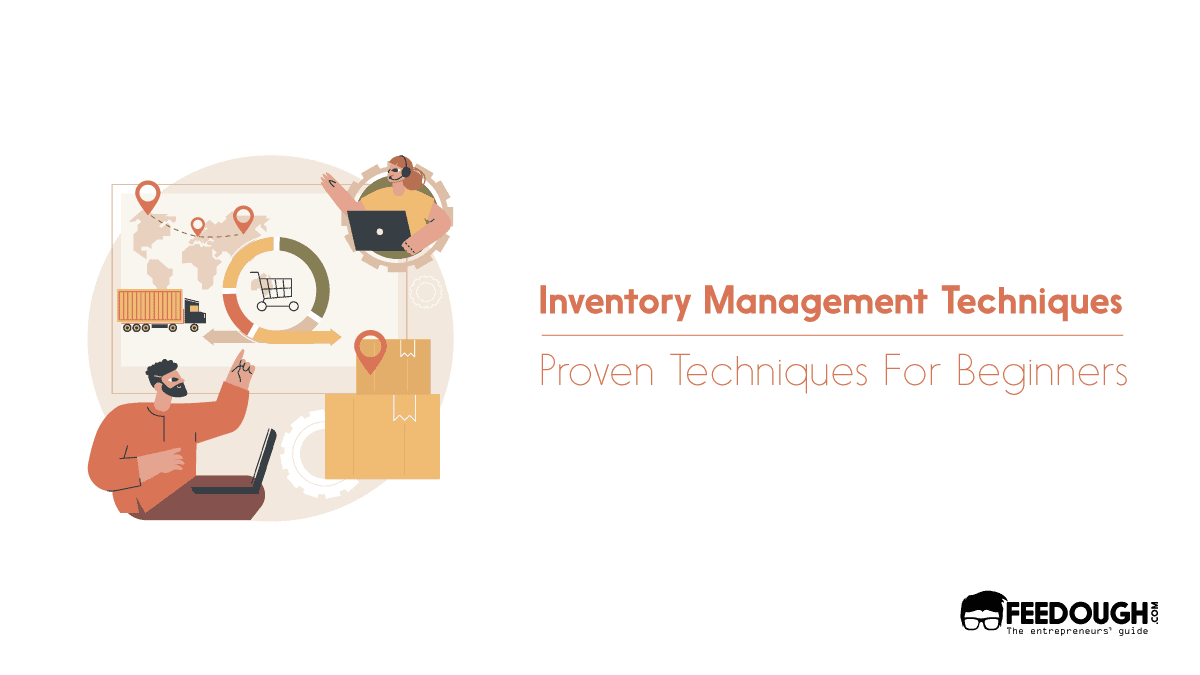
So, how can you manage your inventory effectively? Here’s a guide exploring proven inventory management techniques to help you manage your inventory effectively.
Demand Forecasting
Demand forecasting refers to predicting the quantity of goods and services that consumers will demand at a future time. It uses various techniques, including data analysis and statistical models, to estimate customer demand based on historical data, market trends, economic conditions, and other relevant factors.
It helps you optimise stock levels, reduce holding costs, and ensure a supply chain that quickly responds to your customer demands.
For example, Let’s say you run a retail clothing store and you’re preparing for the upcoming holiday season. Demand forecasting helps you accurately predict which styles, sizes, and colours will be in high demand. By analysing historical sales data from previous holiday seasons, you can identify trends and patterns and align your stock with the projected demand. You’ll know how many units of each popular item to stock up on, ensuring you don’t disappoint customers with out-of-stock items. At the same time, you can avoid the burden of overstocking, which ties up your capital and takes up valuable storage space.
How to do Demand Forecasting?
- Gather historical data: Collect and analyse your past sales, customer orders, and market information to discover patterns and trends in demand.
- Identify external factors: Consider factors like the economy, market trends, demographics, and your competitors’ actions. These can help you better understand the bigger picture and make more accurate forecasts.
- Choose a forecasting method: Select the right method for your business and data. You can use techniques like time series analysis, regression analysis, qualitative forecasting, or even machine learning algorithms.
- Put your chosen method into action: Use the method you selected to generate forecasts based on your historical data and external factors. This might involve running statistical models or applying algorithms.
- Evaluate and adjust as needed: Compare your forecasts to actual sales data to see how accurate they are. If you notice any differences, adjust your approach accordingly. This is a continuous process of monitoring and improving your forecasts.
- Collaborate with your stakeholders: Share your forecasts with your production teams, suppliers, and sales and marketing departments. Collaborating with them ensures everyone is on the same page and can optimise the supply chain to meet the forecasted demand.
- Regularly update your forecasts: Demand patterns can change, so it’s important to update your forecasts regularly with new data and market insights. This helps you make adjustments to your strategies, inventory levels, and production plans as needed.
ABC Analysis
ABC analysis is an inventory management technique that categorises inventory items based on their importance to the business. The analysis divides items into three categories—A, B, and C—based on their importance, with “A items” being high-value items that require close control, “B items” being moderately priced items with moderate control, and “C items” being numerous low-value items with minimal control.
It offers you a systematic approach to prioritise your resources and efforts effectively, ensuring efficient inventory management with different levels of importance.
For example, Let’s say you run a restaurant, it can be helpful to utilise ABC analysis to categorise your ingredients as A, B, and C items based on their importance to the menu and profitability. A items are high-value ingredients that are essential to your signature dishes. Focus on managing these items closely to ensure consistency and quality. The B items are moderately priced ingredients that are used in a variety of dishes on the menu. While these ingredients are important, they do not have the same impact as the A items. You need to ensure an adequate stock of these items but may not monitor them as closely or reorder them frequently. Finally, the C items are low-value ingredients that are used in limited quantities or in less popular menu items. These ingredients are often readily available and inexpensive. Maintain basic control of these items but don’t need to devote extensive resources to their management.
By categorising ingredients as A, B, and C items based on their importance, you can allocate resources more effectively, minimise the chances of running out of crucial items, and streamline your overall inventory management.
How to do ABC Analysis?
- Define categories: Determine the criteria you will use to assess the importance of each item in your inventory. Consider factors like sales volume, revenue generated, or profitability. Choose criteria that align with your company and industry.
- Gather data: Collect the necessary data about your inventory items, such as sales history, cost of goods sold, and profit margin.
- Sort the items: Arrange the items in descending order based on your chosen criteria. This will categorise them as A, B, and C items, with A items being the most important.
- Calculate percentages: Determine each category’s cumulative item and turnover percentages. The cumulative item percentage represents the proportion of the total value or quantity accounted for by each category. The turnover percentage indicates the proportion of sales or inventory turnover attributed to each category.
- Set up ABC analysis: Use a tool like Microsoft Excel to create an ABC analysis table or Pareto chart. These visuals will help you identify the impact and importance of each category at a glance.
Just-in-Time (JIT) Inventory
Just-in-Time (JIT) Inventory is a technique in inventory management where inventory is acquired or produced just in time to fulfil customer orders or demand. Instead of maintaining large stockpiles of inventory, JIT focuses on having the right amount of inventory at the right location and time.
For example, Let’s say you have a manufacturing company. By using JIT Inventory practices, you can coordinate with suppliers to deliver raw materials just before they are needed on the production line. This minimises the need for extensive storage space and reduces the risk of excess inventory. By implementing JIT principles, you can operate with greater efficiency and responsiveness to your customer needs.
How to Implement Just-in-Time (JIT) Inventory?
- Establish Clear Communication Channels: Encourage open communication channels with your suppliers to ensure timely delivery of materials or products. Establish strong partnerships and agreements to support JIT objectives.
- Implement Lean Manufacturing Principles: Streamline your production processes to eliminate waste, reduce lead times, and enhance efficiency. This involves improving workflow, reducing setup times, and optimising production schedules.
- Adopt Kanban System: Implement a Kanban system to signal when to produce or reorder inventory based on actual demand. This visual signalling system helps maintain optimal inventory levels and facilitates a pull-based production system.
- Monitor and Analyse Demand: Use accurate demand forecasting techniques to anticipate customer needs and adjust inventory levels accordingly. Regularly monitor sales trends and adjust production schedules in response to changes in demand.
- Optimise Supplier Relationships: Work closely with your suppliers to ensure prompt delivery of materials or products. Establish agreements for just-in-time deliveries and build strong partnerships to support efficient supply chain management.
- Continuous Improvement: Continuously evaluate and refine your processes to enhance efficiency, reduce waste, and improve responsiveness to customer demand. Encourage a culture of continuous improvement to drive ongoing enhancements in JIT practices.
VED Analysis (Vital, Essential, Desirable)
VED Analysis, which stands for Vital, Essential, Desirable, is an inventory management technique that classifies inventory items into three categories:
Vital (V) items are critical to the organisation’s operations, and their unavailability could cause significant disruptions. These items are crucial and require careful management and attention to ensure availability.
Essential (E) items are necessary for the organisation’s day-to-day operations but do not have the same criticality level as vital items. While their absence may not cause immediate disruptions, they are still important for the smooth functioning of the business.
Desirable (D) items are those that are nice to have but not essential for the organisation’s operations. These items have a lower priority than vital and essential items and can be managed differently based on their demand and availability.
For example, Imagine you’re managing inventory for a healthcare organisation. Using the VED Analysis technique, you categorise your medical supplies as follows:
Vital (V) items: These are critical medical supplies needed for life-saving treatments, such as emergency medications, ventilators, and defibrillators. It’s crucial always to have an adequate stock of these items to handle emergencies and maintain patient safety.
Essential (E) items: These are everyday medical supplies necessary for routine patient care, such as bandages, syringes, and disinfectants. While not life-threatening if unavailable, they are essential for providing quality healthcare services. You need to manage their inventory to meet regular demand and avoid shortages.
Desirable (D) items: These are non-critical supplies that are nice to have but not essential for immediate patient care, like specialised equipment or certain drugs used less frequently. Manage these items considering their demand and cost, ensuring they don’t take up excessive resources.
By categorising items into these three categories, you can allocate resources effectively, ensuring that essential items are prioritised in monitoring, stocking, and replenishment.
How to implement VED analysis?
- Begin by identifying all your inventory items, including raw materials, work-in-progress, finished goods, and other items kept in stock.
- Categorise each item into one of the three VED categories: Vital, Essential, or Desirable. This classification is based on the item’s importance and its impact on your business operations.
- Prioritise your inventory management efforts accordingly. Focus on the Vital and Essential items by closely monitoring their stock levels, maintaining buffer stock, and ensuring timely procurement to prevent shortages and maintain uninterrupted operations.
- Adjust your approach for the Desirable items. Manage them based on their demand and cost implications, avoiding excessive stock holding and resource allocation.
Material Requirements Planning (MRP)
Material Requirements Planning (MRP) is an inventory management technique that involves manufacturers ordering inventory based on sales forecast considerations. MRP systems analyse the demand for finished products and current inventory levels to determine the quantity and timing of materials needed for production. This allows for efficient planning and scheduling, minimising inventory carrying costs, and ensuring materials are available when needed. Using this data and market demand, you can carefully place orders with material suppliers for new inventory. MRP systems can be software-based or performed manually.
For instance, imagine you run a manufacturing company, and you utilise MRP to plan the production of a specific product. The MRP system gathers data on that product’s sales forecast, its components’ current inventory levels, and the lead time required to procure those components from suppliers.
Based on this data, the MRP system calculates the precise quantity and timing of each component needed for production. It generates a detailed production schedule, outlining when each material should be ordered and when it should be used in the manufacturing process.
Through this approach, you can optimise your inventory levels, preventing stockouts while also minimising excess inventory.
How to implement Material Requirements Planning (MRP)?
- Gather the necessary data: Collect all the required data on sales forecasts, current inventory levels, and lead time needed to procure components from suppliers.
- Set up an MRP system: Choose an MRP system that suits your business, whether it’s a software-based solution or a manual approach. Implement the system and configure it according to your specific needs.
- Analyse your demand and inventory levels: Utilise the MRP system to analyse the demand for your finished products and evaluate your current inventory levels. This analysis will help you determine the exact quantity and timing of materials required for production.
- Determine your material requirements: Based on the demand and inventory analysis, you can identify the specific components and quantities needed for production. This information will be used to generate a materials requirement plan.
- Generate your production schedules: Utilise the MRP system to generate production schedules that specify when you should order materials and when they should be used in the production process. These schedules will ensure that materials are available when you need them, avoiding delays and disruptions.
- Place orders with your suppliers: Carefully place orders with your material suppliers based on the generated production schedules. This will ensure that materials are delivered on time and prevent any stockouts.
Economic Order Quantity (EOQ) Model
The Economic Order Quantity (EOQ) technique enables companies to determine the optimal quantity of inventory to order and when to place the order. With the EOQ model, you can set a reordering level and initiate restocking when your inventory reaches that level. Using the EOQ model, you can minimise both the costs associated with placing an order and the costs of carrying excess inventory. This model ensures that you order the right inventory quantity to optimise your operations.
For example, Let’s say you run a retail store. The EOQ model can help you maintain the right balance of inventory. By calculating the optimal order quantity, you can avoid stockouts that lead to lost sales while also minimising the holding costs of excess inventory. This technique allows you to maintain a lean and efficient inventory system, improve customer satisfaction, and reduce costs. By ordering the right inventory quantity at the right time, you can optimise your operations and maximise profitability.
How to implement Economic Order Quantity (EOQ) Model?
- Gather the Necessary Data: Start by gathering essential data related to your demand rates, ordering costs, and holding costs. Accurate and up-to-date information is important for precise calculations using the EOQ model.
- Apply the EOQ Formula: Utilise the EOQ formula to determine the optimal order quantity for your inventory. The formula is as follows:
EOQ = √( (2 * Demand * Ordering Cost) / Holding Cost)
Plugging in the relevant data values allows you to calculate the EOQ that minimises your total inventory costs. This calculation helps you strike the right balance between ordering too much or too little.
- Implement Reordering Policies: Develop clear reordering policies based on the EOQ calculations. Determine the appropriate reorder point, which indicates when you need to reorder inventory. Additionally, determine the reorder quantity to ensure a timely replenishment of your stock.
Automating Inventory Management Systems
Automating inventory management systems involves utilising technology and software solutions to streamline and optimise the processes related to inventory control and tracking. Automating these systems can reduce manual efforts, increase efficiency, and improve inventory management accuracy. It provides features and functionalities that facilitate various aspects of inventory management, such as inventory tracking, order management, demand forecasting, stock control, integration, and communication.
Additionally, automated inventory management systems offer features for auto-replenishment, which allow for automatic order generation when inventory levels reach predetermined thresholds. With auto-replenishment, you can maintain optimal stock levels without manual intervention. The system continuously monitors inventory levels and triggers automatic purchase orders or production orders to replenish the stock.
For example, Let’s say you have a clothing store, automating your inventory management system can provide various benefits. You can easily track your inventory levels across different channels, ensuring you never run out of stock or overstock items. The system automatically updates inventory as orders are fulfilled, preventing overselling or shipping out-of-stock items. With demand forecasting, you can anticipate popular clothing items and avoid excess stock or shortages. The system also has auto-replenishment features, generating purchase orders when inventory reaches predetermined thresholds. This ensures popular items remain in stock, minimising lost sales opportunities.
Additionally, integrating your inventory management system with your e-commerce platform, point of sale, and accounting software facilitates smooth communication and data synchronisation.
How to Automate Inventory Management Systems?
- Choose the right software: Select inventory management software that suits your business needs and size. Look for features like inventory tracking, order management, demand forecasting, and integration capabilities.
- Set up your inventory: Input your current inventory data into the software. Include item details, stock levels, supplier information, and other relevant data.
- Define replenishment triggers: Determine the thresholds at which the system should generate purchase orders or production orders to replenish stock. This can be based on minimum stock levels, historical sales data, or your specific requirements.
- Integrate with other systems: Connect your inventory management software with other tools you use, such as your e-commerce platform, point of sale, and accounting software. This allows for seamless communication and data synchronisation between different departments.
- Monitor and adjust: Review your inventory reports, demand forecasts, and reorder triggers regularly. Make necessary adjustments to optimise your inventory management processes. This may involve modifying trigger points, updating supplier information, or refining forecasting models.
FIFO
FIFO stands for First-In, First-Out, and it is a method used to manage and value inventory. It is based on the principle that the first inventory items purchased or produced are the first to be sold or used.
Under the FIFO method, the cost of the oldest items in stock is assigned to those units when inventory is sold or used. This means that the inventory cost reflects the actual cost paid or incurred for the items acquired first. The FIFO method is frequently used when you sell goods that have a short shelf life and are prone to spoilage. Using the oldest inventory first helps ensure that items are sold or used before they become outdated or lose value.
For example, if you own a grocery store and sell fresh produce, using the FIFO method would ensure that the first fruits and vegetables acquired are the first ones to be sold. This prevents any potential loss due to spoilage and helps maintain product freshness for your customers. You can minimise waste and maximise profits by prioritising the sale of older inventory. FIFO also accurately represents your costs and inventory values on financial statements, which is essential for effective financial reporting and analysis.
How to implement FIFO?
- Organise your inventory: Arrange your inventory in a way that allows you to identify and track the oldest items easily. Use labels or tags with clear date information.
- Establish receiving procedures: When new inventory arrives, record the receipt dates and store it properly for easy access to older items.
- Train your employees: Educate your staff about the importance of following FIFO and provide clear guidelines on identifying and selecting the oldest inventory for sale or use.
- Monitor your stock regularly: Conduct periodic inventory counts and audits to accurately track inventory levels and identify any discrepancies or issues.
- Rotate your inventory: When restocking shelves or fulfillment locations, ensure that older items are brought forward and placed in front of newer inventory. This will help ensure that older items are sold or used first.
- Utilise inventory management software: Implement inventory management software that supports FIFO calculations and automates inventory tracking according to the FIFO method. This can streamline the process and minimise human errors.
- Review and adjust as necessary: Regularly review inventory turnover rates, expiration dates, and customer demand patterns. Adjust reorder levels, supplier relationships, or forecasting models as needed.
LIFO
LIFO stands for Last-In, First-Out. It is a method used for inventory management where the most recently acquired goods are the first to be sold or used. With LIFO, the cost of the newest items in stock is assigned to those units when they are sold or used. This can result in a different valuation of inventory and costs compared to the FIFO (First-In, First-Out) method. LIFO is often used in industries where prices tend to rise over time, as it can help reduce taxable income by matching higher costs with revenues.
For example, let’s say you run a clothing retail store. When you receive new shipments of clothing, place the most recent items on the sales floor while keeping the older items in the stockroom. As your customers make purchases, assign the cost of the most recently received clothing to those sales, even if older items are still in stock.
By using LIFO in your inventory management, you can potentially increase the valuation of your inventory on the balance sheet, especially in industries where prices rise over time. This can reduce your taxable income by matching higher costs with revenues.
How to implement LIFO?
- Assess and evaluate your existing inventory management system: Before transitioning to LIFO, carefully review your current inventory management practices. Ensure that your accounting software or system can accommodate LIFO and that you have the necessary resources to make the transition smoothly.
- Establish a tracking system: To implement LIFO, tracking the costs associated with each item in your inventory is essential. Maintain detailed records of the date of purchase, quantity acquired, and corresponding price for each item. This will enable you to accurately determine the cost of inventory on a first-in, last-out basis.
- Communicate the change to your team: Ensure all employees involved in the inventory management process understand the shift to LIFO and its implications. Educate them on the importance of prioritising the sale or use of the most recently acquired items. This helps avoid confusion and ensures consistent implementation across your organisation.
- Capture and record inventory transactions: As new inventory purchases are made, record the details of each transaction, including the date, quantity, and associated cost. These records will be crucial for calculating the cost of goods sold under the LIFO method. Additionally, accurately track sales or internal consumption of inventory, noting which specific units are being sold or used.
- Calculate the cost of goods sold: To determine the cost of goods sold using LIFO, assign the costs based on the most recent inventory purchases. The cost assigned to goods sold will be the cost of the most recently acquired units. Make sure to update your inventory levels accordingly, subtracting the units sold or used from the most recent purchases.
- Maintain detailed records and reconcile regularly: It’s important to keep accurate and up-to-date records of your inventory transactions and continuously reconcile them with your financial records. This ensures that your inventory levels and associated costs are properly reflected in your financial statements.
- Review financial statements: Regularly review your financial statements to verify that the LIFO method accurately reflects the costs associated with your inventory over time. This analysis helps ensure the integrity of your financial reporting and provides valuable insights into the financial health of your business.
Perpetual Inventory Management
Perpetual inventory management refers to an inventory system that continuously tracks and updates inventory levels in real time. It involves the use of technology, such as computerised point-of-sale systems, to record inventory changes as they occur. With perpetual inventory management, every transaction of goods received or sold is immediately captured and updated in the inventory records.
For example, Let’s say you run a retail store. By implementing perpetual inventory management, you use a computerised point-of-sale system. This system continuously updates your inventory levels in real-time based on sales transactions. The system deducts the quantity sold from your inventory records whenever a sale is made. If stock levels drop below a set threshold, the system automatically generates purchase orders to restock. You can monitor real-time inventory levels, track sales trends, and access reports on stock movement. At the end of the month, you conduct a physical count to verify the accuracy of your perpetual inventory records.
The benefits of perpetual inventory management include greater accuracy and efficiency in inventory control. It gives you real-time visibility into your inventory, allowing you to make informed decisions regarding procurement, reordering, and sales. Maintaining accurate and up-to-date inventory records can minimise stockouts, optimise inventory levels, and improve overall operational efficiency.
How to implement Perpetual Inventory Management?
- Utilise Technology: Choose a computerised point-of-sale (POS) system or inventory management software that supports real-time tracking and updates. This system will help you keep track of your inventory in real-time.
- Establish Baseline Inventory: Conduct a thorough physical inventory count to determine the accurate stock levels at the beginning of the implementation. This will provide you with a starting point for your inventory records.
- Update Inventory in Real-Time: Record sales transactions using the POS system. The system will automatically subtract the quantity sold from your inventory records, ensuring that your inventory levels are always up-to-date.
- Set Reorder Points: Determine the threshold at which you want to reorder each product. When the stock levels fall below this threshold, initiate an automatic reorder process to ensure you maintain sufficient stock.
- Streamline Procurement: Develop efficient processes for receiving new stock and updating your inventory records. This may involve using barcode scanning or other methods to register incoming inventory accurately.
- Monitor Inventory: Utilise the POS system or inventory management software to keep an eye on your real-time inventory levels. This will help you track sales trends, identify discrepancies, and generate reports on stock movement. Use this information to make informed decisions regarding stock adjustments and inventory management.
- Periodic Physical Counts: Conduct regular physical inventory counts to verify the accuracy of your perpetual inventory records. Any discrepancies between your physical count and the system records should be investigated and resolved.
Minimum Safety Stocks
The minimum safety stock refers to a company’s inventory level to prevent running out of stock. It is the threshold at which a new order is placed before the existing inventory is depleted. It serves as a buffer stock to mitigate stockout risk and maintain business operations continuity.
For example, if your organisation has a total inventory of 20,000 units, you would initiate a new order when your inventory reaches 18,000 units. As a result, the 2,000 units of inventory would constitute your minimum safety stock level.
By maintaining a minimum safety stock level, you can reduce the risk of stockouts, ensure customer satisfaction, and maintain smooth operations.
How to implement Minimum Safety Stocks?
- Calculate the safety stock level: Determine the safety stock quantity by analysing factors like demand variability, lead time variability, and desired service level. You can utilise statistical methods or formulas to calculate the safety stock quantity.
- Review historical data: Examine past sales patterns, demand fluctuations, and lead times to gain insights into your inventory requirements. Look for any seasonality or trends to help inform your safety stock calculations.
- Set the reorder point: Determine the inventory level at which you should initiate a new order to replenish stock and maintain the minimum safety stock. Usually, you calculate the reorder point by adding the safety stock to the average demand during lead time. For example, if your safety stock is 100 units and the average demand during lead time is 50, your reorder point would be 150.
- Implement a healthy inventory management system: Utilise suitable inventory management software or systems to accurately track inventory levels, monitor demand patterns, and generate reorder alerts when your inventory reaches the reorder point.
- Regularly review and adjust safety stock levels: Continuously monitor and analyse demand patterns, lead times, and other factors impacting your inventory requirements. Adjust your safety stock levels accordingly to ensure optimal inventory management.
Fast, Slow & Non-moving (FSN) Method
The Fast, Slow, and Non-moving (FSN) method is an inventory management technique used to classify inventory items into three categories based on their movement. Here’s a breakdown of each category:
Fast-moving (F): These goods sell quickly and have a high turnover rate. They are in high demand and often have a lower profit margin. Keeping a larger volume of fast-moving items in stock is generally recommended to meet customer demand.
Slow-moving (S): These goods have a slower sales rate than fast-moving items. They may have a lower demand or longer shelf life. It is important to carefully monitor and manage slow-moving items to prevent excess inventory and minimise the risk of obsolescence.
Non-moving (N): These are goods that have not had any sales within a defined period. They may be products that have become obsolete or experienced a decline in demand. Non-moving items tie up valuable storage space and tie up capital that could be used for more profitable items. Monitoring and addressing non-moving items is essential to optimise inventory management.
For example, let’s say you have a retail store selling clothing items. You can apply the Fast, Slow, and Non-moving (FSN) method to manage your inventory effectively by:
Fast-moving (F): Identify items like basic t-shirts, popular jeans, or trendy accessories that sell quickly and have a high turnover rate. These items are in high demand, so it’s important for you to keep a sufficient stock of them. For example, if you sell 100 units of basic t-shirts per week, classify them as fast-moving items.
Slow-moving (S): Look for items like seasonal jackets, special occasion dresses, or niche accessories that have a slower sales rate than fast-moving items. These items may have a specific target market or lower demand, so managing their stock carefully is essential. For example, if you sell only 2-3 units of a particular specialty dress per month, classify it as a slow-moving item.
Non-moving (N): Identify items like outdated fashion trends, products with low customer demand, or discontinued items. These items have not sold within a defined period and occupy valuable storage space. It’s important for you to address non-moving items promptly to free up space and prevent inventory holding costs. For example, if a specific style of shoes has not sold in the last six months, it would be considered a non-moving item that requires attention.
By classifying items into these categories, you can understand the movement patterns of their inventory and make informed decisions about stocking levels, procurement, and inventory control.
How to implement the Fast, Slow & Non-moving (FSN) Method?
- Identify Your Inventory Items: Look at your inventory items and categorise them based on how well they’re selling and moving quickly. Sort items into fast-moving (F), slow-moving (S), or non-moving (N) categories based on their demand and sales history.
- Plan Your Replenishment Strategies: Make sure you have enough stock of fast-moving items to meet customer demand and restock them regularly to prevent running out of stock. Develop strategies to boost sales of slow-moving items, such as promotions, and consider discounting or discontinuing non-moving items.
- Monitor and Analyse Regularly: Keep a close eye on how your inventory items are performing, track their movement, and adjust your inventory management strategies as needed. Review and update the categorisation of items based on their sales patterns regularly.
Reorder point formula
The reorder point formula is used to calculate the point at which you should reorder inventory to avoid stockouts. It takes into account the lead time for order fulfilment and the average daily demand during that lead time. The formula is as follows:
Reorder Point = (Lead Time Demand) + Safety Stock
The Lead Time Demand is the average daily demand multiplied by the lead time, which is the time it takes for the supplier to deliver the ordered items.
The Safety Stock is an additional amount of inventory kept to account for any unforeseen variations in demand or lead time. You can eliminate the uncertainty of reordering by establishing reorder points, ensuring they maintain optimal inventory levels without experiencing shortages or excess stock.
For example, Let’s say you run a small retail store that sells electronic gadgets. You can use the reorder point formula to avoid stockouts and ensure you always have enough inventory on hand.
First, you need to calculate the lead time demand. Let’s say the average daily demand for a specific gadget is 20 units and it takes your supplier 5 days to deliver an order. The lead time demand would be 20 units per day multiplied by 5 days, equaling 100 units.
Next, you need to consider the safety stock. This is an additional buffer inventory that you keep to account for unexpected fluctuations in demand or possible delays in order fulfilment. Let’s say you decide to maintain a safety stock of 50 units.
Using the reorder point formula: Reorder point = (Lead Time Demand) + Safety Stock
Reorder Point = 100 units + 50 units
Reorder Point = 150 units
This means that when your inventory level reaches 150 units, it’s time to place a new order to replenish your stock. By maintaining a reorder point, you can effectively manage your inventory and avoid the risk of running out of popular products while also preventing the accumulation of excessive inventory that ties up your capital.
How to implement the Reorder point formula?
- Determine your average daily demand: Calculate the average number of units you typically sell per day for the specific product.
- Calculate the lead time: Determine the lead time, which is when your supplier delivers the ordered items from the moment you place an order.
- Multiply your average daily demand by the lead time: Multiply your average daily demand by the lead time to calculate the lead time demand. This represents the expected demand during the lead time.
- Determine your safety stock: Consider factors like demand variability and supplier reliability to determine the appropriate level of safety stock, which acts as a buffer inventory for unexpected variations in demand or lead time.
- Apply the reorder point formula: Add the lead time demand to the safety stock to calculate your reorder point. The formula is:
Reorder Point = Lead Time Demand + Safety Stock - Monitor your inventory levels: Regularly review your inventory levels and compare them to the calculated reorder point. When your inventory level reaches or falls below the reorder point, it’s time to initiate a new order to replenish your stock.
Batch tracking
Batch tracking, also known as lot tracking, is a technique used in inventory management that involves the use of batch numbers to track and trace goods throughout the distribution chain. It allows you to monitor your raw materials, work-in-progress inventory, and finished goods effectively, minimising the storage of unusable items in your warehouse.
For example, let’s consider that you have a manufacturing company that produces pharmaceutical products. You assign a unique batch number to each production run or lot by implementing batch tracking. This batch number captures important information such as the manufacturing date, location, and specific ingredients used in the production process.
Each batch number is tracked and associated with the corresponding products throughout the distribution chain, from suppliers to end customers. This enables you to to quickly identify the specific batch in the event of quality issues, such as a product recall or customer complaints.
Additionally, batch tracking helps you to ensure compliance with regulations and quality control standards. In industries like food, pharmaceuticals, and electronics, where safety and quality are critical, batch tracking plays an important role in maintaining product visibility and meeting regulatory requirements.
How to implement Batch Tracking?
- Assign Batch Numbers: Start by assigning unique batch numbers to each production run or lot of products. These numbers should capture important information such as the manufacturing date, location, ingredients/components used, and other relevant details.
- Record Batch Information: Maintain a centralised database or system where you can record and track the batch information. This system should be easily accessible and allow for quick retrieval of batch-related data when needed.
- Track Movement: Track the movement of products with batch numbers along the distribution chain. Record when each batch is received from suppliers, processed in production, stored in inventory, and shipped to customers.
- Integrate with Inventory Management Systems: Ensure that your batch tracking system is fully integrated with your inventory management software. This integration enables seamless tracking of batch numbers as products move in and out of your inventory.
- Perform Quality Control Checks: Implement quality control checks at various stages of the production and distribution process to ensure that products within each batch meet the set standards and specifications.
- Conduct Regular Audits: Conduct regular audits to verify the accuracy and completeness of batch tracking data. This helps to identify any discrepancies or issues early on and ensures data integrity.
Days sales in inventory (DSI)
Days Sales in Inventory (DSI) is a metric used to measure the average number of days or time it takes for a company to convert its inventory into sales. It provides insights into how quickly your inventory is being sold and helps evaluate the efficiency of inventory management. Additionally, you can gain valuable insights concerning:
- The effectiveness of your inventory management practices.
- The level of demand for your inventory.
- The amount of capital that is tied up in your inventory.
Let’s say your cost of goods sold (COGS) over the past year was $500,000, and your average inventory holding for the year was $125,000. Using these figures, you can calculate your DSI as
DSI = (Average Inventory / Cost of Goods Sold) x 365
DSI = ($125,000 / $500,000) x 365
DSI = 91.25 days
This means that it takes you an average of 91.25 days to convert your inventory into sales. If the industry average for DSI is 60 days, your higher DSI of 91.25 suggests that your inventory turnover is slower than average. You may need to review your inventory management practices, such as evaluating stock levels or assessing the performance of slow-moving products.
This way, you can aim to expedite inventory turnover, reduce carrying costs, and optimise your working capital.
How to implement Days sales in inventory (DSI)?
- Gather the necessary data: You will need the average inventory value and the cost of goods sold (COGS) for a specific period.
- Calculate the average inventory value: Add the period’s beginning and ending inventory values and divide by 2 to obtain the average inventory value.
- Calculate DSI: Divide the average inventory value by the COGS and multiply by the number of days in the measurement period (usually 365 for annual statements).
DSI = (Average Inventory / COGS) x 365 days - Interpret the DSI: A lower DSI indicates that your inventory is being sold quickly, while a higher DSI suggests slower inventory turnover. Compare your DSI to industry benchmarks to assess the efficiency of your inventory management