[Reader Disclosure]Our content is reader-supported. This means we may earn a commission if you click on some of our links.
Amazon has experienced rapid growth in the past few years, especially with AWS’s introduction and the pandemic’s onset. The company has an enormous ecosystem with a number of business models in place. Thus, it becomes crucial to look at the various Amazon statistics and trends in its user base, revenue generation, and the number of active sellers on the marketplace to understand the company’s complex business model.
Amazon was started as an online bookstore in the basement of its founder, Jeff Bezos. Today the company sells about 380 million products on its marketplace and is popularly called ‘the everything store.
The Amazon marketplace is a two-sided ecommerce platform connecting buyers to third-party sellers. The marketplace provides a platform for buyers and sellers to interact and trade with each other. The buyers get to choose from multiple options available on Amazon, whereas the sellers get to connect with an established base of buyers and sell their products.
Amazon Statistics: Users And Other Demographics
Combined desktop and mobile visits: 2.4 billion
Amazon Prime annual subscribers: 220 million
Annual valuation of Amazon: $1.6 trillion (in 2022)
Number of countries Amazon serves in: 214 countries
The online population of Amazon’s empire: over 1.2 billion
98% of the customers say they purchase on Amazon almost every day
Amazon operates in 18 global marketplaces in 200+ countries and territories, where it has 200 million Prime subscribers. The Prime-eligible countries are the United States, United Kingdom, Spain, Japan, Italy, Germany, France, Canada, Austria, and India.
Amazon’s age demographics include adults aged 18 to 60, with 45% in the 35-49-year-old age group. The number of Prime subscribers has been increasing continuously over the past few years, as the company reported 200 million members at the end of the fourth quarter of 2022. Amazon saw a double increase in its prime users, from 100 million in 2018 to 200 million in 2022.
In 2023, Amazon stood at the 9th position in global internet traffic engagement. A whopping 66.98% of the total traffic on the platform is from the United States in 2023. Of these, 58% of visitors come from mobile devices, while desktops drive 42% of visits.
It is one of the most popular shopping apps in the United States. In July 2022, the Amazon app secured second place with a monthly mobile audience of 98 million.
Both Amazon and Walmart have seen an increase in their e-commerce sales share in the United States from 2019 to 2022. Where Amazon clearly dominates Walmart in this area, as Amazon was responsible for about 44.9 per cent of e-commerce sales in the US in the second quarter of 2022, while Walmart was responsible for only 5.4 per cent.
According to Amazon Prime members statistics by eMarketer, the favourite Prime subscription benefits are:
Free two-day shipping (83%)
Video and music streaming (10%)
Exclusive deals at Whole Foods (5%)
Free audiobooks & magazines (1%)
Other benefits (1%).
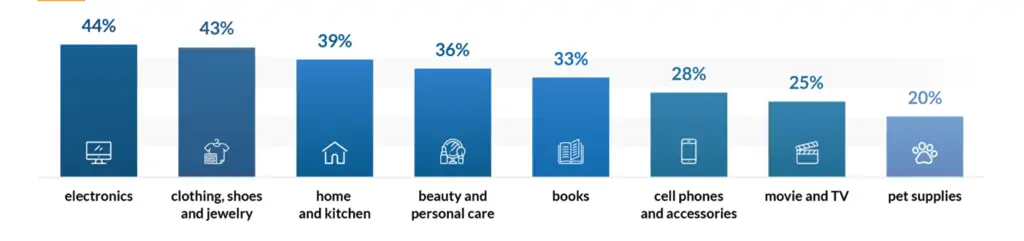
Here are the most frequently bought products on the site are shown below:
Amazon Business Statistics
Number of packages shipped per day: 1.6 million (66k/hour and 18.5/second)
Number of acquisitions: Spent over $ 44.49B for 97 acquisitions
Number of investments made: 93 investments
9th position in global internet traffic engagement
Customer satisfaction score in 2021: 78 out of 100 ASCI points
Most popular shopping app in the United States
Moreover, 26% of the visitors on Amazon buy the first product they see on the Amazon search results page. At the same time, 46% of them scroll through at most two pages before buying a product. Amazon often ranks at the top of shoppers’ list for price checking as 9 out of 10 shoppers check out the marketplace for price comparison, customer service, and shipping speed.
Amazon Seller Statistics
Number of sellers that join Amazon marketplace every day: 3,700
Number of active sellers on Amazon marketplace: 6 million
Number of products sold on Amazon: 380 million products:
Percentage of sales by third-party sellers: 59.0%
Percentage of sellers that also sell on other platforms: 80%
A majority of small and medium-sized businesses (69%) spend less than $5,000 to start a business on Amazon, and 32% spend less than $1,000 — with most sellers using their own cash.
Amazon Marketplace sells about 380 million products, out of which 12 million are sold by Amazon itself. Moreover, More than 3700 sellers join the Amazon marketplace every day. The company’s statistics show that around 6 million sellers currently use the platform. There are 2.3 million active sellers of these, as the rest do not have any product listed on the platform.
In the first quarter of 2022, 55% of the sales were done by third-party sellers. While In the fourth quarter of 2022, third-party sellers sold 59% of the units on Amazon, reaching 59% of sales in the first quarter of 2023. The number increased by 7% since last year from 55.0%.
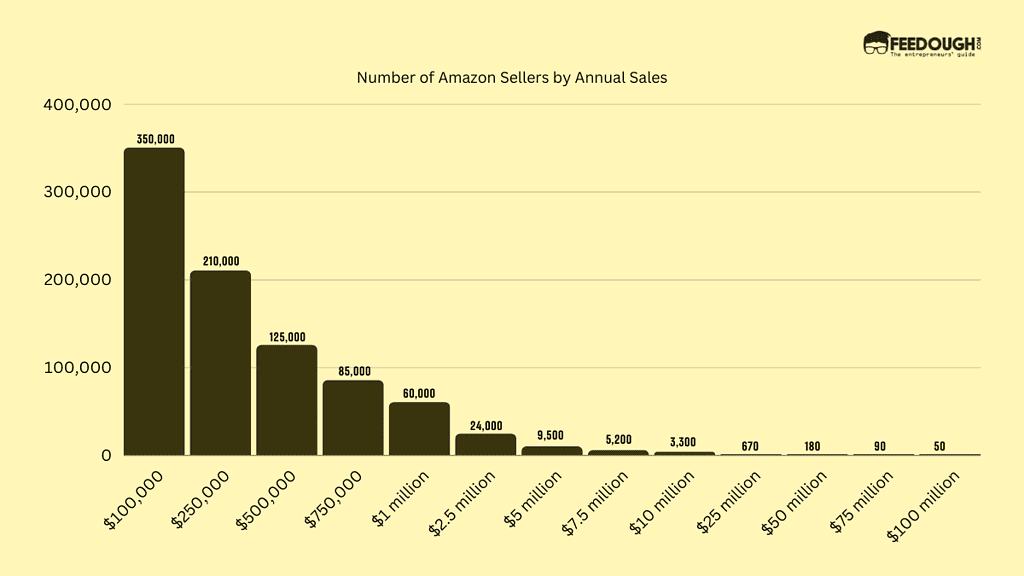
A number of Amazon Sellers – In 2021, 60,000 third-party sellers surpassed $1 million in sales, and about 350,000 sellers fetched over $100,000 in sales.
Amazon Revenue Statistics
Amazon Revenue Statistics
Net income in 2022: Amazon hit nearly 514 billion U.S. dollars in net sales revenue worldwide in 2022
Amazon Market capitalisation in 2022: Over 960 billion U.S. dollars.
Cash conversion cycle in March 2023: -3.91 (As of Mar. 2023)
Amazon Online Stores Sales (Gross merchandise volume (GMV)): From $222.07 billion in 2021, it decreased by -1% to $220.00 billion in 2022.
Total revenue of Amazon in 2023: $524.89 B
Average money spent by Prime members: $1400 per year
Average money spent by non-Prime members: $600 per year
4th company to reach $1 trillion market capitalisation
The second-largest public company by revenue in the world
Amazon’s revenue grew 37.6% in the financial year 2020. The company saw the largest percentage increase in revenue since 2011. The revenue from third-party sellers, which was $80.6 billion, was the second-largest revenue source for the company after retail product sales. Amazon also witnessed an increase of 48% from the 2020 year’s income in Q2 2021. Its income in Q2 2020 was $5423 million, while in Q2 2021, the income grew to $7778 million.
But, by the year-end of 2021, Amazon’s income was 33%, 2022 was not a good year for Amazon’s sales. As, of the end, by December 31, 2022, Amazon’s income was at $-2.722B, a 108.16% decline from 2021. And by the Q1 of 2023, the net income of Amazon is $3,172.00 million, down by -183% year-over-year from $-3,844.00 million.
Amazon was not very profitable for the first 15 years of its existence, as most of the profits were reinvested into the company. But, with the onset of AWS, the company has been witnessing booming profits of over $10 billion in 2018 and more than $20 billion in 2020. But, again, after seeing a hike of 33% in revenue in 2021, the company witnessed a loss of -183% in 2023.
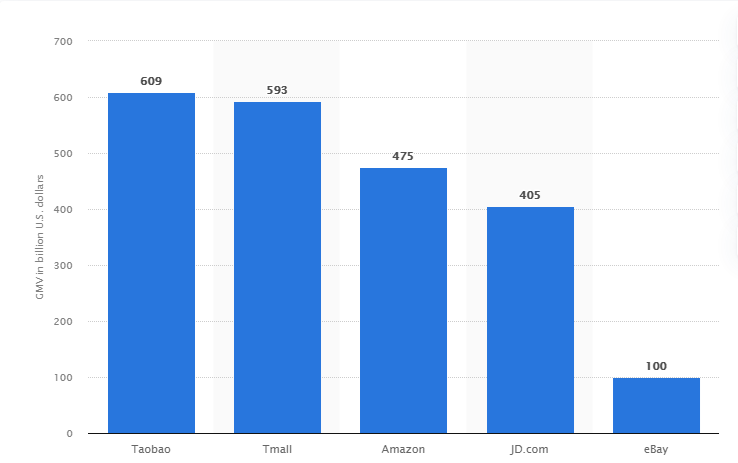
In 2020, Amazon marketplace became the third most popular online marketplace with 475 billion dollars in gross merchandise value. Taobao was the most popular, while Tmall ranked second.
However, as of May 2023, Amazon became the most popular online marketplace worldwide, with average visits of about 4.79B billion that month.
Amazon Employee Statistics
Number of employees in 2023: 1.6 million
Highest publicly traded tech companies by the number of employees.
Percentage of women in the global workforce: 47.8%
Cents earned by women for every dollar earned by men: 99.6 cents
In 2023, Amazon employed around 1.6 million full and part-time employees. This was an increase from 798000 employees in 2019 to 1,608,000 in 2023. In 2023, the company was the highest-ranked tech company based on the number of employees. When Foxconn had 826,608, Alibaba had 243,903, Microsoft had 221,000, and Amazon had 1,541,000 at the same time.
According to Amazon, the company’s global workforce includes 47.8% of women. The numbers have constantly improved as Amazon employed 41.9% females in 2018 and 42.7% in 2019. The company also states that women earn 99.6 cents for every dollar that men earn performing the same jobs and promises to improve continuously. Also, minorities earned 99.2 cents for every dollar that white employees earned performing these same jobs.
Amazon Web Services Statistics
The number of websites using Amazon (as of 7th May 2023): 65,940,013 websites:
Revenue generated by AWS in Q4 2022: Approximately 21 billion U.S. dollars
Revenue from Amazon Web Services (AWS): $21.35 billion
AWS is responsible for a major proportion of Amazon’s revenue. In the fourth quarter of 2022, the segment generated 21 billion in net sales, an increase from $11.601 billion generated in Q3 2021.
In 2023, it’s one of the fourth largest public cloud providers, with Microsoft Azure serving 60 regions and 116 Availability Zones, Google Cloud Platform (GCP) serving 34 regions and 103 Availability Zones, and Alibaba Cloud serving 27 regions and 84 Availability Zones, while Amazon Web Services (AWS) serving 26 regions and 84 Availability Zones.
Ravpreet is an avid writer, prone to penning compelling content that hits the right chord. A startup enthusiast, Ravpreet has written content about startups for over three years and helped them succeed. You can also find her cooking, making singing videos, or walking on quiet streets in her free time.
Each week I share research backed AI oriented content in my newsletter.
There are AI ideas, AI trends, tutorials, and guides.
24k entrepreneurs read it. I'd love you to join.