[Reader Disclosure]Our content is reader-supported. This means we may earn a commission if you click on some of our links.
Managing a project is complex and requires extensive organisational and managerial skills. Communication, collaboration, planning, and execution, all fall on project managers.
If you’re a new project manager, you might not be familiar with the different project management techniques and methodologies available to overcome different types of challenges.
Having a good understanding of them will give you visibility into what type of technique is appropriate for your project at any given time.
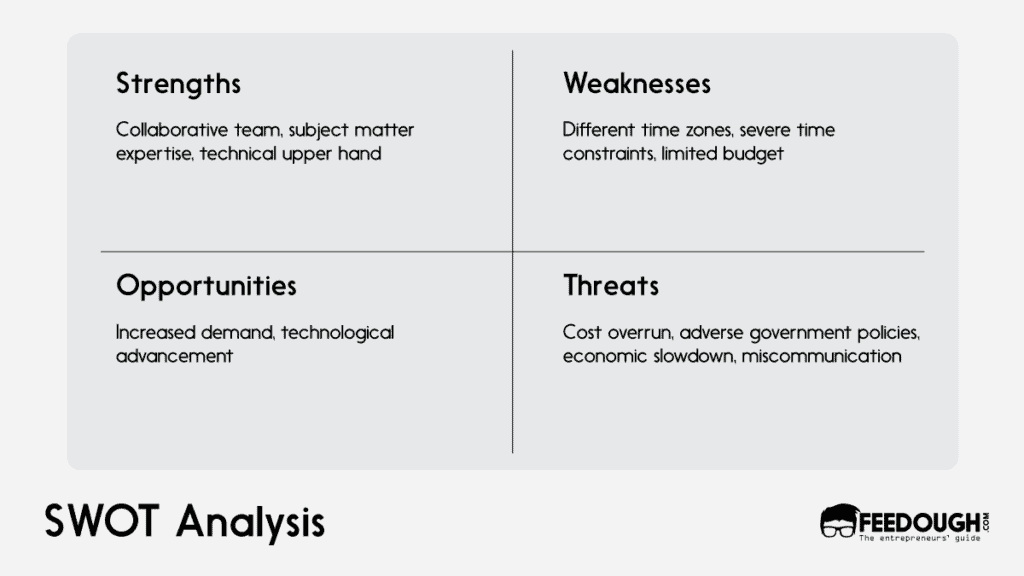
SWOT is an acronym for Strengths, Weaknesses, Opportunities and Threats. Project managers use this method to identify the strong points in a project; where there are opportunities to exploit; areas that need improvement; and threats that must be neutralised or averted (if possible).
This analysis involves internal and external factors. The goal of analysing SWOT is to explore a project’s environment, assess its potential and define how the success of the project can be ensured.
When To Use SWOT Analysis?
SWOT is an essential part of project initiation. It is also used to evaluate the current status of a project and re-plan and execute it with increased efficiency. This project management technique helps in:
Evaluating internal and external factors that can affect a project.
Identifying opportunities for strategically positioning the product or service offering.
Ascertaining which areas must be strengthened to take advantage of identified opportunities.
Pinpointing weaknesses that may result in failure to take advantage of opportunities, if these decisions are implemented without considering SWOT.
Exploring how well-aligned projects are to achieve their vision, mission, strategic objectives and business goals.
How To Conduct A SWOT Analysis?
Strengths refer to those aspects of a project that are going well.
Weaknesses refer to those areas of the project or organisation that need improvement.
Opportunities refer to external factors that present advantages for the project.
Threats refer to external factors that pose challenges for the project.
The following matrix can be used to structure SWOT analysis
This matrix indicates which factors require more planning and resource allocation, so you can focus on them first. It gives an indication of what needs attention first at any time during the life cycle of a project.
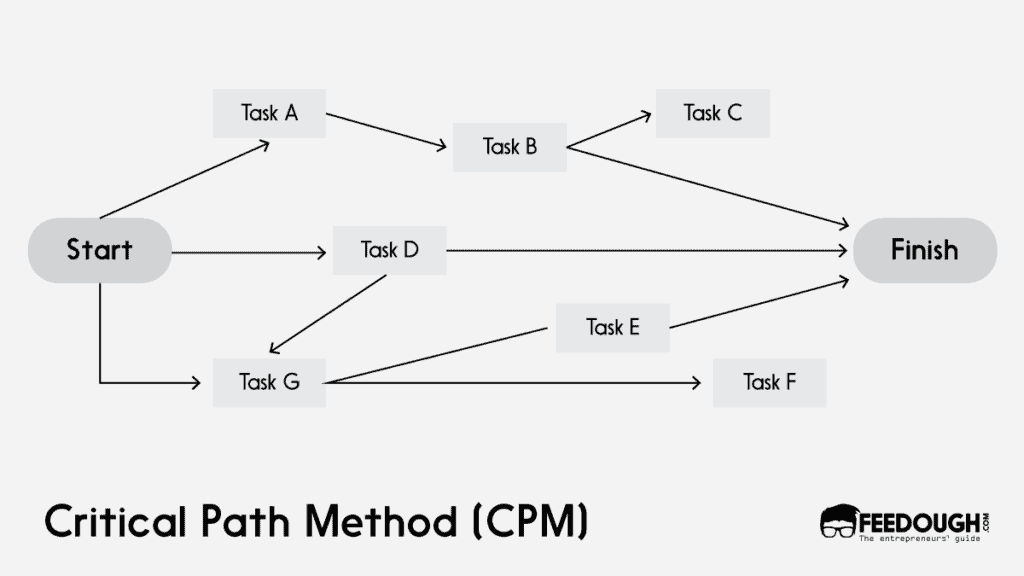
Critical Path Method (CPM)
The critical path method is used to understand the duration required by the longest sequence of events in a project network without any slack time. This means it helps determine how long it will take to complete the entire project if tasks are started on time.
This project management technique is used in projects with interdependent activities that lead to a final product or service delivery. Not all activities will have dependencies, while some may be dependent on others
The successful construction of the critical path depends on planning and scheduling properly, assessing risks accurately, managing resources efficiently, and putting in place an effective communications plan
When To Use CPM?
CPM helps determine the earliest date when an entire project can be completed by identifying the longest sequence of events without any slack time (float). This information is useful for resource allocation and cost estimation purposes. It also helps identify whether certain tasks must be finished before moving on to others.
How To Use CPM?
CPM can be used to plan, schedule and monitor a project. There are several steps involved in the process, as follows:
Identify all activities required to complete a project.
Distinguish between dependent and independent activities as well as those that cannot start until others have been completed.
Maintain a network diagram to depict the sequence of events with estimated durations for each task
Estimate activity completion time and expected time of the project’s completion.
Plot the diagram to show the sequence and duration of events from start to finish.
This project management method helps in determining which tasks have a direct effect on the final delivery date. If any tasks take more time than planned, it affects the entire project.
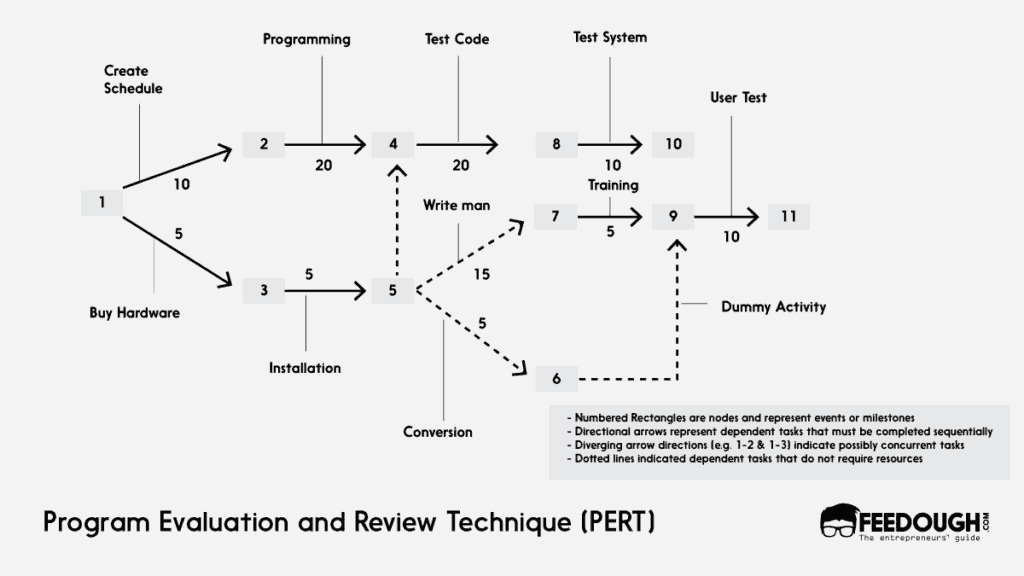
Program Evaluation and Review Technique (PERT)
PERT or Programme Evaluation and Review Technique is a project planning, scheduling, and control method that uses a network diagram to depict the tasks required to be accomplished, identifying the relationships among these.
The diagram has three components:
Tasks required to be accomplished
Nodes, which are points where three or more activities meet
Times at which each task begins and ends
Rather than considering a project’s start and end, this project management approach is event-oriented. It requires you to outline the tasks (the critical ones) and then assesses the time needed to accomplish them. Here, you find the following for each task:
Optimistic Time (O): The minimum possible time required to finish a task (that is, when everything proceeds better than expected)
Most likely Time (M): The optimum time needed to complete a task (that is, when everything proceeds as expected)
Pessimistic Time (P): The maximum possible time required to finish a task (that is when everything goes wrong)
When To Use PERT?
PERT is useful in projects that are not linear (consecutive) but have non-sequential activities. It helps understand how much time each task will take to complete, which tasks must be completed before moving ahead with others. It also helps identify the critical paths and manages risk using event trees.
How To Use PERT?
PERT has three steps, as follows:
Identify the tasks required to complete a project and their interrelationships
Plot these on a network diagram showing when each task must start and end. Include an estimate of the time it will take to complete each task.
Draw a graph that shows all paths from beginning to end, including the earliest path (Critical Path), which is likely to be the shortest
If you deviate from this path, it will cause a delay in project delivery. PERT can also identify alternatives or dependencies if an activity is delayed and help determine the consequences.
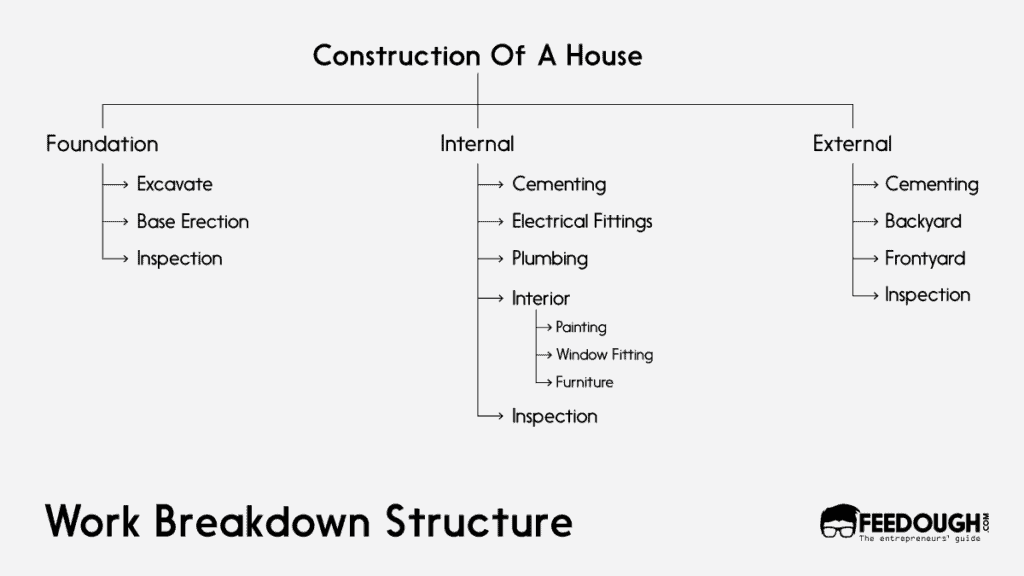
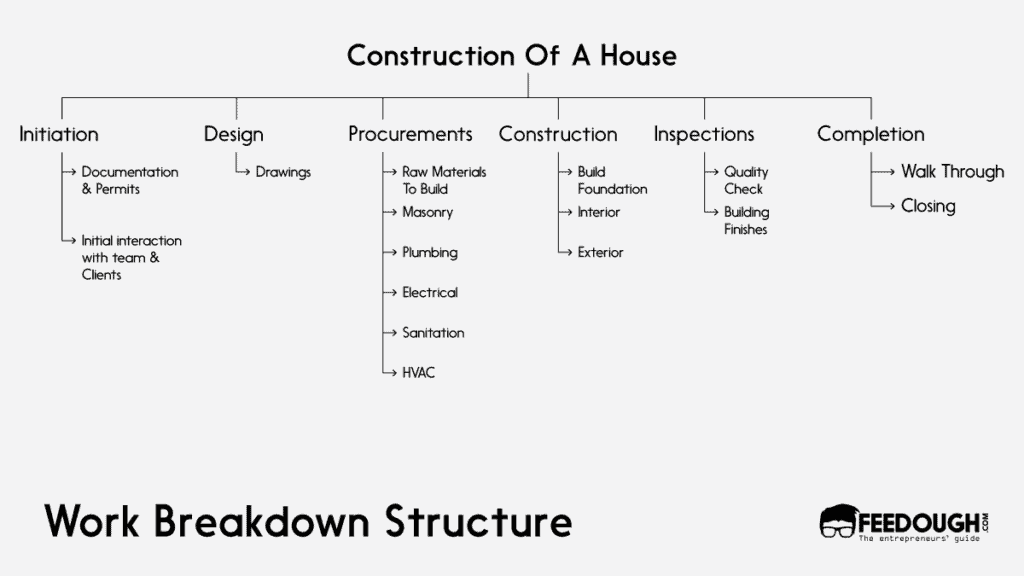
Work Breakdown Structure
Work Breakdown Structure is a list of all individual tasks that together complete the project. It provides detailed information about each activity required to complete the project, including what will be done, who will do it and when they will do it. This project management technique also includes a time estimate for each activity
A WBS is often displayed with a tree diagram — a top-down list that shows the project at progressively lower levels of detail. It visually represents the project in its entirety and how it decomposes into smaller components or activities required to complete it, making it easy to identify tasks, assign
When To Use WBS?
A typical WBS is developed during the planning phase of project management and used as a reference throughout the project lifecycle. A WBS provides the organisation with a valuable structure to plan and manage its projects when properly designed and maintained. It also makes it easy to track project progress and identify any delayed or missing activities that may affect overall project delivery.
How To Develop A WBS?
WBS requires careful analysis of all project deliverables in order to identify each activity required to complete them.
It is a tree-like tool that helps you break down the deliverables and project’s scope into smaller doable tasks. Here, each deliverable is divided into manageable sections, and each section is divided into smaller tasks so that the work is completely broken down into simple activities.
You can develop a WBS in five steps:
Identify the boundaries of the project
Gather the requirements, details and descriptions for each task required to complete the project
Break these down into sub-tasks
Identify the resources each task will require
Assign timeframes for performing tasks
Another way to develop a WBS is to go with a phase-oriented approach. That is, you divide the work into different phases and then further divide each phase until you can list the exact deliverables.
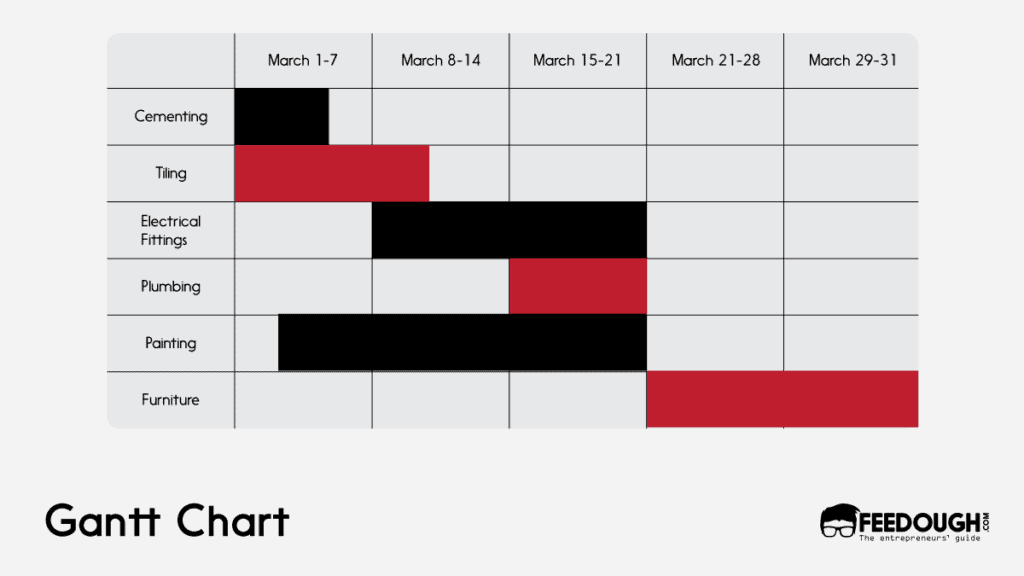
Gantt Chart
A Gantt chart is a bar chart that shows the start and finish dates for each task and the percentage of time the task has been completed. As such, it provides an at-a-glance understanding of how tasks are progressing against deadlines and milestones.
When To Use Gantt Chart?
Gantt charts are bar diagrams that illustrate project schedules. Each bar represents a distinct activity, and its length represents the activity duration.
Thus, a Gantt chart tells you about:
The activities needed to be done to complete the project
Duration of each activity
Scheduled timeline of each activity
How much activities overlap
The start and end date of the project
How To Develop A Gantt Chart?
Gantt charts are most suitable when the project is not in its early planning stages. Since Gantt charts allow you to track project progress, they’re best used after you’ve established a baseline for how long it takes to complete activities and tasks.
You can develop a Gantt chart in four steps:
Identify project milestones and important tasks
Figure out the time it takes to complete each task
Place the activities on a timeline according to their start and end dates
Determine overlap, if any, between certain tasks (this will help identify resource requirements)
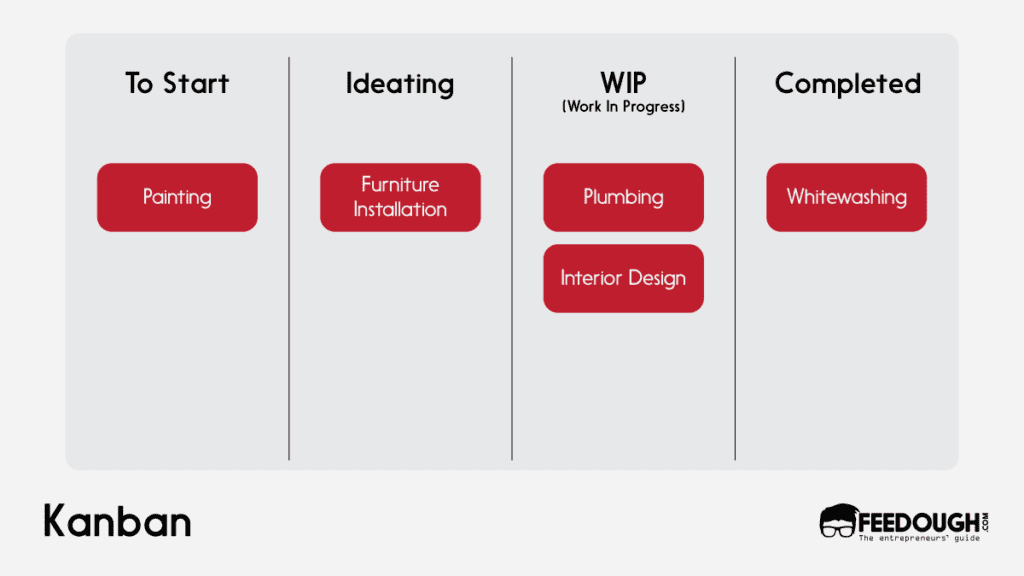
Kanban
Kanban is a Japanese word meaning ‘visual signal’. In project management, Kanban is a lean management framework that supports the effective flow of work items to delivery. It is a simple visualisation tool that helps manage workflow and reduce delays by making information visible at a glance.
Kanban boards are used in project management to visualise workflow, make work-item progress transparent, and improve the efficiency of production throughput. In Kanban systems, each work item is represented as a card containing the item’s details and moves from one step to another in the workflow.
Kanban cards are placed on a board or any other place where they can be visualised.
When To Use Kanban?
Kanban boards are used when the project has dynamic work items that require regular tracking and monitoring to meet deadlines.
Also, if your team is distributed across multiple locations, you would need a Kanban board to keep everyone on track at all times.
How To Develop A Kanban Board?
You can create a Kanban board using sticky notes or index cards. For example, to represent different workflow stages, you might use red for development, green for testing and blue for deployment.
Here are some tips to optimise your Kanban experience
Use just enough columns to represent all the steps in your workflow
Give each column a specific purpose, such as Backlog, In progress etc.
Use cards to represent work items
Limit the number of cards that can stack in any column by placing limits on the workflow stage
RACI
RACI is an acronym used in project management to describe the role of various individuals involved in projects. RACI stands for:
R = Responsible – The person performing the task decides how the task is completed and will be accountable for its completion.
A = Accountable – The person whose signature or stamp is required so that work product or deliverable is approved.
C = Consulted – The person who provides input and/or recommendations on a particular issue or task.
I = Informed – The person has been communicated to about the status of a given issue but is not actively involved in it.
RACI Matrix helps you determine which member should be responsible for a given task, accountable for its completion, consulted in decisions and kept in the loop. This project management technique identifies the members that must be involved in a task and those who do not need to know about it.
An expanded version of RACI is RACI-VS, where V and S respectively stand for:
Verify – The person who affirms the quality of work.
Sign off – The person who authorises handing over the deliverables and back the verification.
When To Use RACI Matrix?
RACI matrix is useful when you have multiple stakeholders involved in a project, and each team member has their own specific role and duty.
How To Create A RACI Matrix?
Create a table in Excel and add the names of all the project team members. Identify the role each member plays in a particular task; we will use ‘R’ for responsible, ‘A’ for accountable, and so on.
For each task, assign the name of the role to be responsible for it in the appropriate column
Add another column adjacent to it, enter ‘X’ if no one is responsible. If more than one person has the same role (i.e. they can both be responsible), add their names in this column separated by a comma. Once you’re done, identify the number of people involved in each column
Finally, tally the results and compare them against your original assumptions to ensure that you’ve assigned tasks accurately.
Person 1
Person 2
Person 3
Person 4
Person 5
Task A
C
A
I
R
I
Task B
A
R
R
C
I
Task C
I
C
C
R
A
Task D
C
I
A
I
R
Task E
R
C
I
A
C
Stakeholder Matrix
A stakeholder is any person directly or indirectly affected by the project. They may be the organisation’s senior managers, project sponsors, business partners, third-party vendors, or even the end-users.
A stakeholder matrix captures identifying information on key stakeholders and their respective roles.
This project management method helps you determine which stakeholders to engage with during the course of a project and when to do it.
When To Use A Stakeholder Matrix?
Before you start working on the project, it is important to identify stakeholders who will have a direct or indirect impact. Use the Stakeholder matrix when you anticipate that there could be a delay in completing the project if only some key people are engaged at later stages of the process.
How To Create A Stakeholder Matrix?
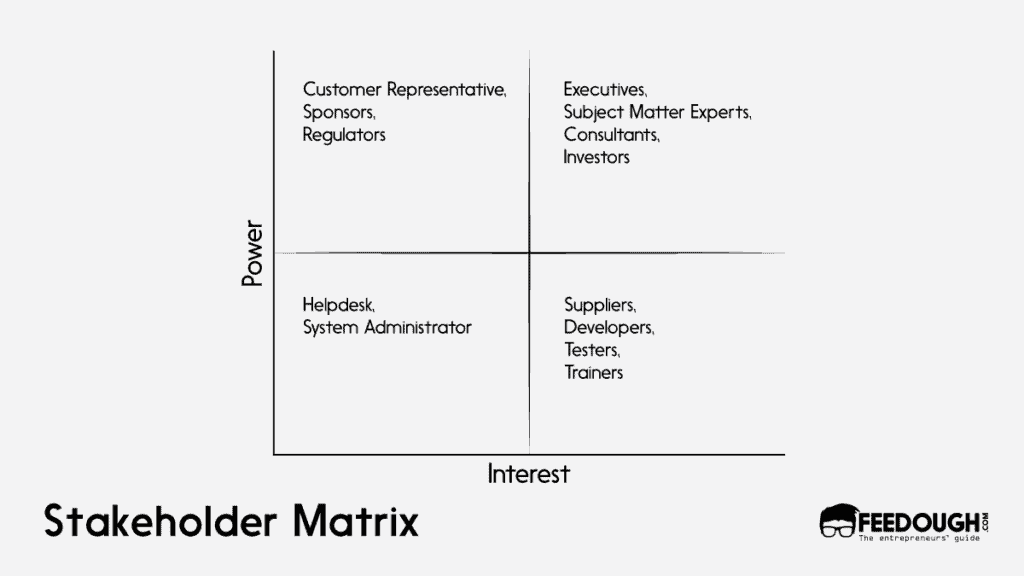
Stakeholder matrices are divided into four quadrants where you map each stakeholder according to their level of power and interest in the project. This way, you can assess their importance and impact on the project and make your decision wisely.
First quadrant (high interest, high power): They are the key players, and you need to manage closely with them.
Second quadrant (low interest, high power): You need to keep them satisfied
Third quadrant (low interest, low power): You don’t need to put much effort here. Just monitoring will do.
Fourth quadrant (high interest, low power): You need to keep them informed of the developments for ideal project execution.
For instance, in a business project, the executive board and SMEs usually fall in the first quadrant while customers, sponsors, and regulators fall in the second one. Helpdesk and system administrators fall in the third quadrant while suppliers, developers, testers, and trainers belong to the fourth one.
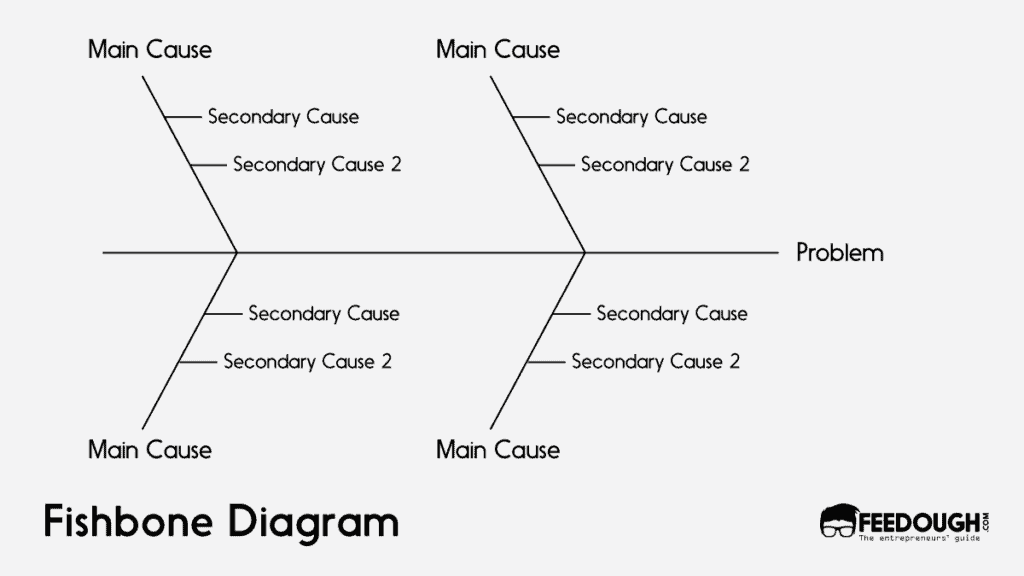
Fishbone diagram
Fishbone diagram, also known as Ishikawa diagram or cause and effect diagram, is a problem-solving tool used in quality management. It encourages brainstorming to find the root cause of a particular issue.
It can be used in any industry where goals are set for continuous improvement within the organisation. However, it is most popularly used by manufacturing companies because it helps them find and eliminate the root cause of defects and errors.
When To Use A Fishbone Diagram?
You can use the Ishikawa diagram to isolate the root cause leading to a particular effect. For example, if you’re dealing with a customer complaint where the product returns increased over time, you’ll first need to find the root cause. Then you’ll need to find out how this could be prevented in future.
How To Create A Fishbone Diagram?
Draw a fish with the head pointing towards the problem or effect that needs to be addressed
Add sub-heads along the spine that further explain where the problem originates from
List key factors under each sub-head
Visualise how these factors are connected to one another to find the root cause of the problem.
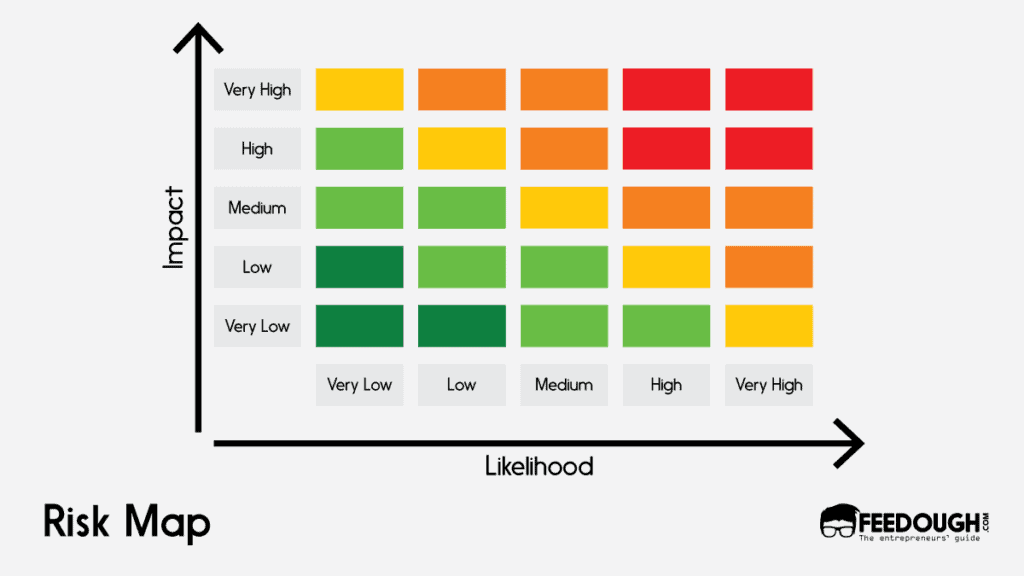
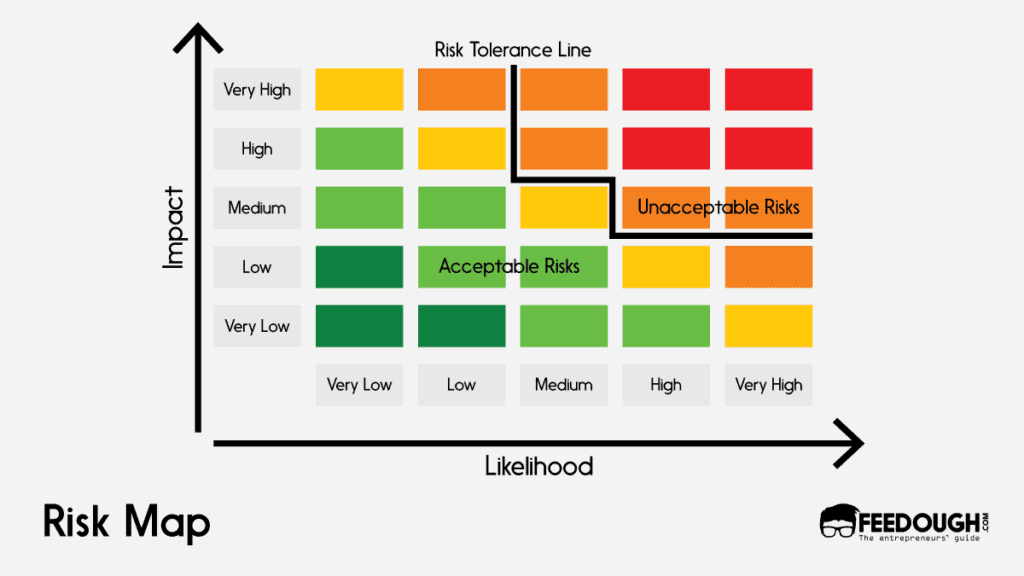
Risk Map
A risk map is a diagram that maps out all possible risks due to factors within and outside the project. This tool allows you to map potential risks based on their impact and likelihood. Here, you assess the probability of different risks and their effects on the project and then lay them down on the risk chart.
When To Use Risk Map?
Risk maps can be used at any time during project execution, but it is most useful when the project plan is being drawn because it allows you to identify and assess risks beforehand. This way, you can take steps to avoid the risk or mitigate it, depending on its impact on your project.
How To Create Risk Map?
You can make a risk map by plotting risks on two axes:
Their likelihood of occurring (X-axis)
Their impact on the project (Y-axis)
One of the main features of risk maps is risk tolerance lines. These lines represent an organisation’s risk tolerance capacity: how much risk it is willing and able to take at a given point. The risks below this line are not a problem, but one needs to plan effectively for the ones above it.
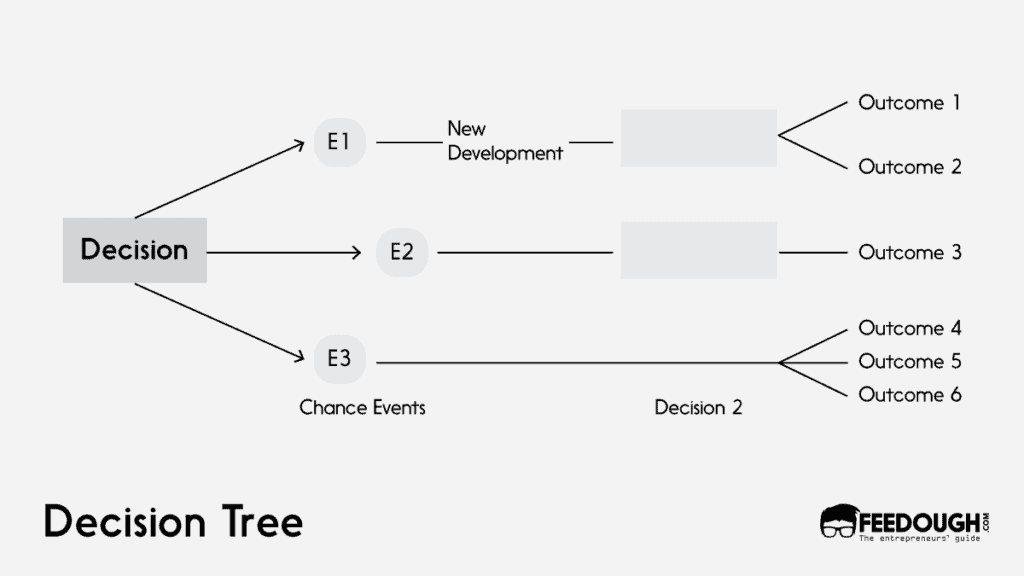
Decision Tree
A decision tree is a decision-making tool that allows you to map out all possible consequences of a decision. It is a branch of a tree with each branch representing a potential consequence and its sub-branches representing the subsequent effects of the decisions made at branches.
When To Use A Decision Tree?
You can use decision trees to visualise how one course of action leads to another, and how the decisions taken at one stage influence future events. You can also use this project management technique to reveal hidden patterns in decision making and make better choices by showing the consequences of each choice.
How To Create A Decision Tree?
Draw a tree with the problem or decision at the root
Decision paths become the main branches of the tree
Each branch represents the consequences of that particular decision
Sub-branches represent additional consequences based on decisions taken in previous stages
Finally, at the end, you need to compare each branch and sub-branch for better decision making.
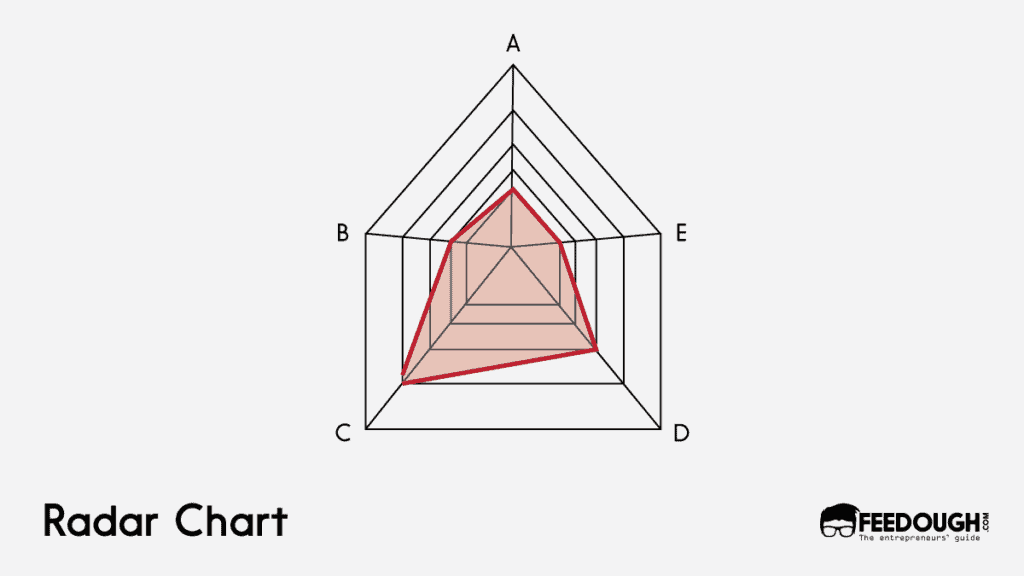
Radar Chart
Radar charts or web charts are a visual data representation tool. They have a disc-shaped appearance and show interrelated quantitative values distributed along several axes. In this way, they can easily convey complex information to the viewer, who will see different pieces of information without being confused by how their data is organised on paper.
When To Use A Radar Chart?
Radar charts are helpful if you have a number of factors that influence the project, and you need to show how they’re related. For example, if four areas affect your project’s success and you want to see how these areas interact with each other, then a radar chart is perfect for this purpose.
You may also use this project management technique to compare risks, progress status, and budget overdue among different projects.
How To Create A Radar Chart?
It involves a regular polygon whose vertices represent an activity. The points on a line from the centre to a vertex represent the magnitude of the parameter. The closer a point is to the centre, the less the magnitude is.
For instance, if you want to record and compare progress on six project tasks, you may draw the following radar chart.
Task
Progress Status (Proportion of the activity completed)
A
20%
B
30%
C
80%
D
60%
E
20%
Go On, Tell Us What You Think!
Did we miss something? Come on! Tell us what you think of this article on Project management techniques in the comments section.
A startup consultant, digital marketer, traveller, and philomath. Aashish has worked with over 20 startups and successfully helped them ideate, raise money, and succeed. When not working, he can be found hiking, camping, and stargazing.
Each week I share research backed AI oriented content in my newsletter.
There are AI ideas, AI trends, tutorials, and guides.
24k entrepreneurs read it. I'd love you to join.


")