
TikTok took four years to reach 800 million users. Facebook needed eight. ChatGPT cleared that number in under two years and kept climbing.
ChatGPT statistics from 2026 show the platform crossed 1 billion monthly active users in June, with 900 million logging in weekly as of February. CEO Sam Altman estimates roughly one in ten people on Earth now uses ChatGPT systems.
Here is what the data reveals about the speed of adoption, the revenue it is generating, and the structural shift underneath it all.
Key ChatGPT Statistics for 2026
ChatGPT crossed 1 billion weekly active users by August 2026, roughly three years after launch, and the growth curve shows no sign of flattening.
- 900 million weekly active users as of February 2026 (up from 400 million a year earlier)
- Weekly active users more than doubled in 12 months (February 2025 to February 2026), representing a 125% year-over-year increase
- Growing by about 57 million new weekly users per month
- Passed 1 billion weekly active users in August 2026
- Annualized revenue exceeded $25 billion by February 2026 (up from $10 billion ARR in June 2025)
- Monthly revenue roughly tripled year over year, reaching approximately $2 billion per month
- 50 million paying subscribers across all tiers as of April 2026, with 10 million Plus subscribers generating $2.4 billion in annual subscription revenue
- 1.5 million enterprise customers as of March 2025
- 73.4 million app downloads in December 2025 (the single-month record)
- 770 million installs in 2025, making ChatGPT the most downloaded mobile app globally (surpassing TikTok and Instagram)
- $1.35 billion in consumer spending in 2025
- Average revenue per download: $2.91 globally, $10 in the U.S.
- Gender split as of February 2026: 54% male, 46% female
- Age distribution: 45% under 25, 54% between 18 and 34
- Top countries by user volume: United States 19%, India 15%, Brazil 8%, Philippines 6%, United Kingdom 5%
- India leads in daily usage intensity at 36% versus the global average of 17%
- Denmark: 56.5% monthly usage, 15.2% daily
- Japan: 57.2% monthly usage, 7.1% daily (lowest daily rate globally)
- Workplace seats passed 7 million with enterprise seats growing roughly 9x year over year; more than 9 million paying business users across over 1 million business customers
- Over 92% of Fortune 500 companies have integrated ChatGPT into their workflows
- Industry adoption rates: Marketing professionals 65%, Journalists 64%, Developers 63%
- 61% of companies globally use ChatGPT for writing tasks
ChatGPT User Growth and Scale Statistics
ChatGPT became the fastest app in history to reach 1 billion monthly active users, hitting that mark in June 2026. TikTok needed nearly four years to reach the same threshold. The headline number, though, understates what is happening inside the product: people are using it more with each passing quarter, and for reasons that have less and less to do with work.
Metric | Value | Context |
|---|---|---|
Monthly active users | 1 billion (June 2026) | Fastest app in history to reach this milestone |
Cumulative downloads | 1 billion | Fastest to this mark per Sensor Tower |
Daily prompts | 2.5 billion | 330 million from U.S. users |
Queries per session | 1.75 (Feb 2026) | Up from 1.16–1.21 in 2025 |
Non-work messages | 68.9% (March 2026) | Up from 59.8% in early 2025 |
The jump in queries per session from 1.16 to 1.75 tells the story the user count does not. People are running multi-turn conversations and returning for follow-ups, treating the platform as a persistent tool rather than a one-shot search box. Non-work messages climbed from 59.8% to nearly 69% in just over a year, confirming that ChatGPT is becoming a daily habit well beyond the workplace.

ChatGPT Revenue and Monetisation Statistics
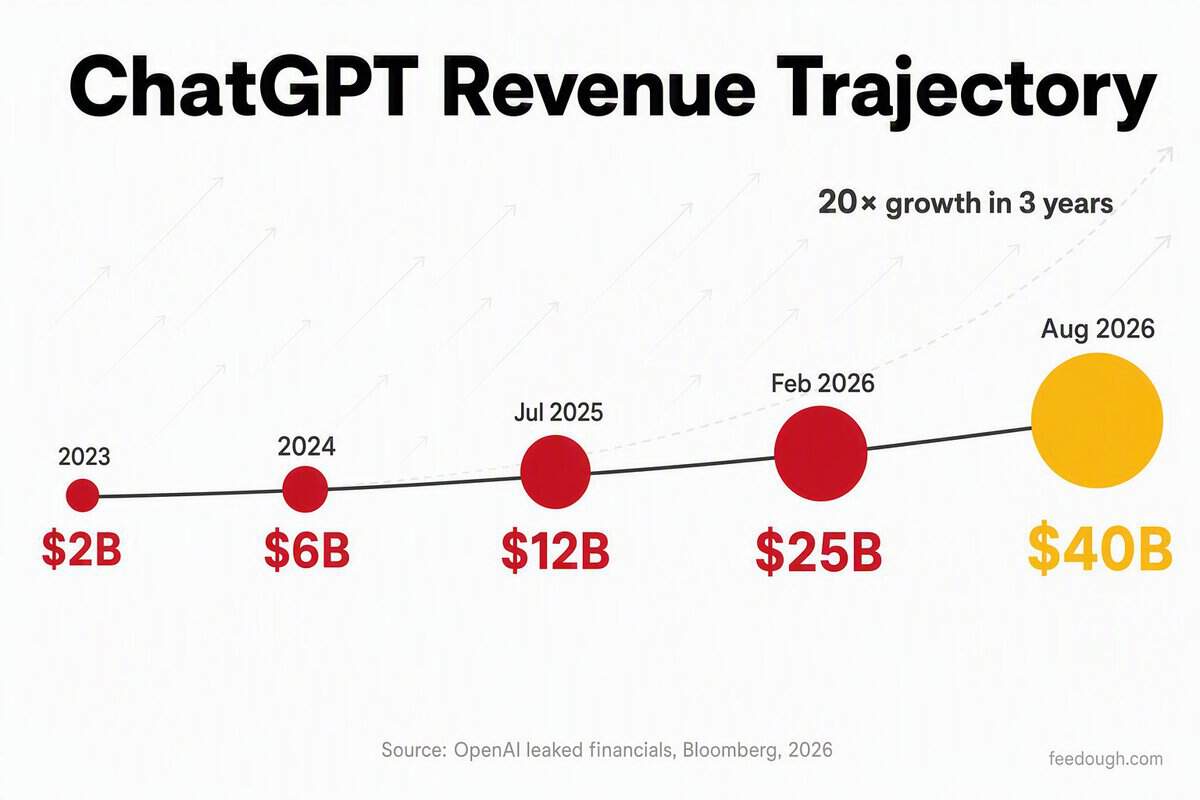
OpenAI’s annualized revenue hit $40 billion by August 2026. Most enterprise software firms take a decade or more to reach that run rate, if they ever do. The company crossed $1 billion in monthly recurring revenue in October 2025 and has not slowed since.
Period | Annualized Revenue | Growth |
|---|---|---|
2023 | $2 billion | Baseline |
2024 | $6 billion | 3x year-over-year |
July 2025 | $12 billion | 2x year-over-year |
February 2026 | $25 billion | 2x in roughly 7 months |
August 2026 | $40 billion | 60% in 6 months |
- ChatGPT subscriptions: 55% of revenue (approximately $22 billion annually)
- API consumption: 30% (approximately $12 billion)
- Sora, advertising, and licensing: 15% (approximately $6 billion)
Enterprise revenue overtook consumer revenue for the first time in July 2026, ahead of the originally projected year-end timeline. The retention gap explains the shift: enterprise customers hold an 88% one-year retention rate, compared to 68% for Team subscribers and 59% for Plus subscribers. Those contracts carry higher values and lower churn, making each enterprise dollar stickier than its consumer equivalent.
ChatGPT Mobile App Revenue and Usage Statistics
ChatGPT became the fastest non-game app in history to reach $5 billion in mobile consumer spending, hitting that mark in roughly three years. No other non-game app has approached that pace.
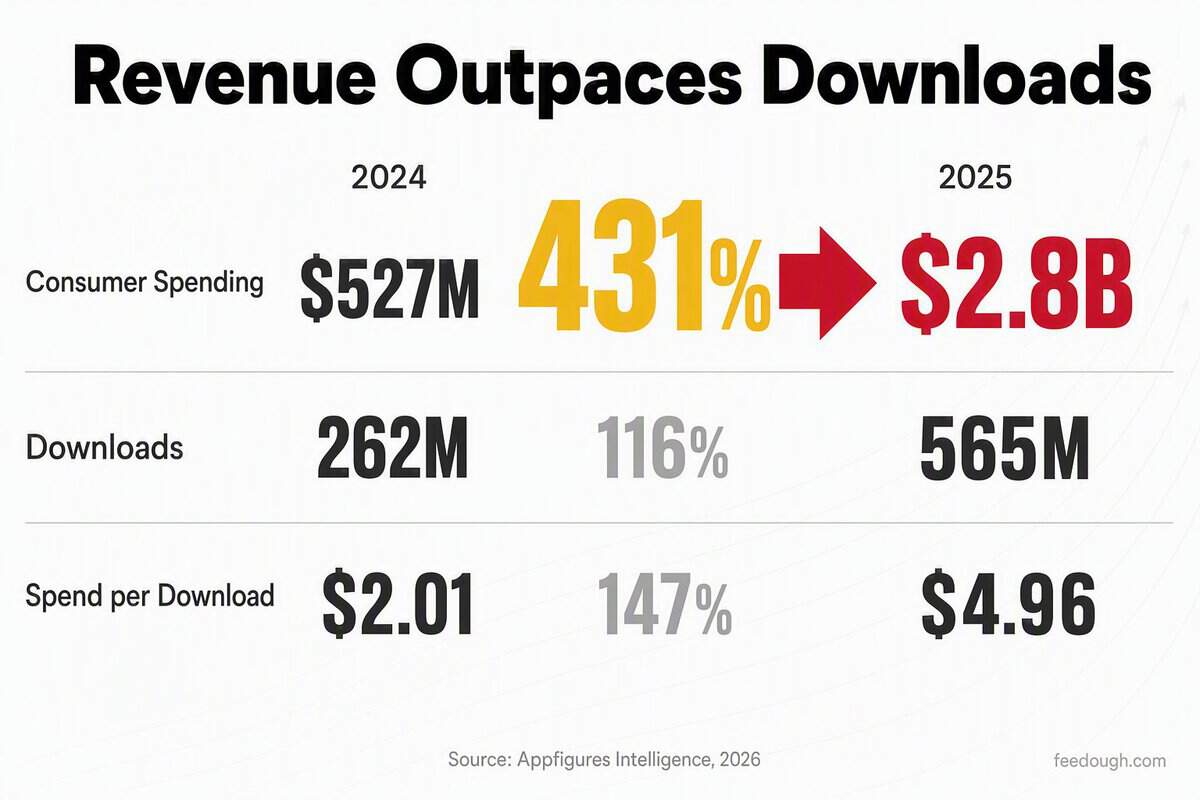
The spending numbers tell a different story than the download numbers. Consumer revenue hit $2.8 billion in 2025, up from $527 million the year before. Downloads grew 116%, from 262 million to 565 million. Revenue grew 431%. The gap between those two growth rates is where the monetization story lives.
Metric | 2024 | 2025 | Growth |
|---|---|---|---|
Consumer spending | $527 million | $2.8 billion | 431% |
Downloads | 262 million | 565 million | 116% |
Spend per download | ~$2.01 | ~$4.96 | 147% |
The per-download revenue has kept climbing into 2026. Worldwide consumer spend per download rose from $4.18 in April 2025 to $5.83 in April 2026, a 39% jump. December 2025 posted the highest single-month figure at $6.87 per download. Daily active users reached 218 million by April 2026, up from 192 million at the end of 2025. Monthly consumer spending hit $301 million in April 2026, up 34% year over year. The first four months of 2026 alone produced $1.3 billion in cumulative consumer spending, up 121% from the same stretch in 2025.
ChatGPT App Download and Store Ranking Statistics
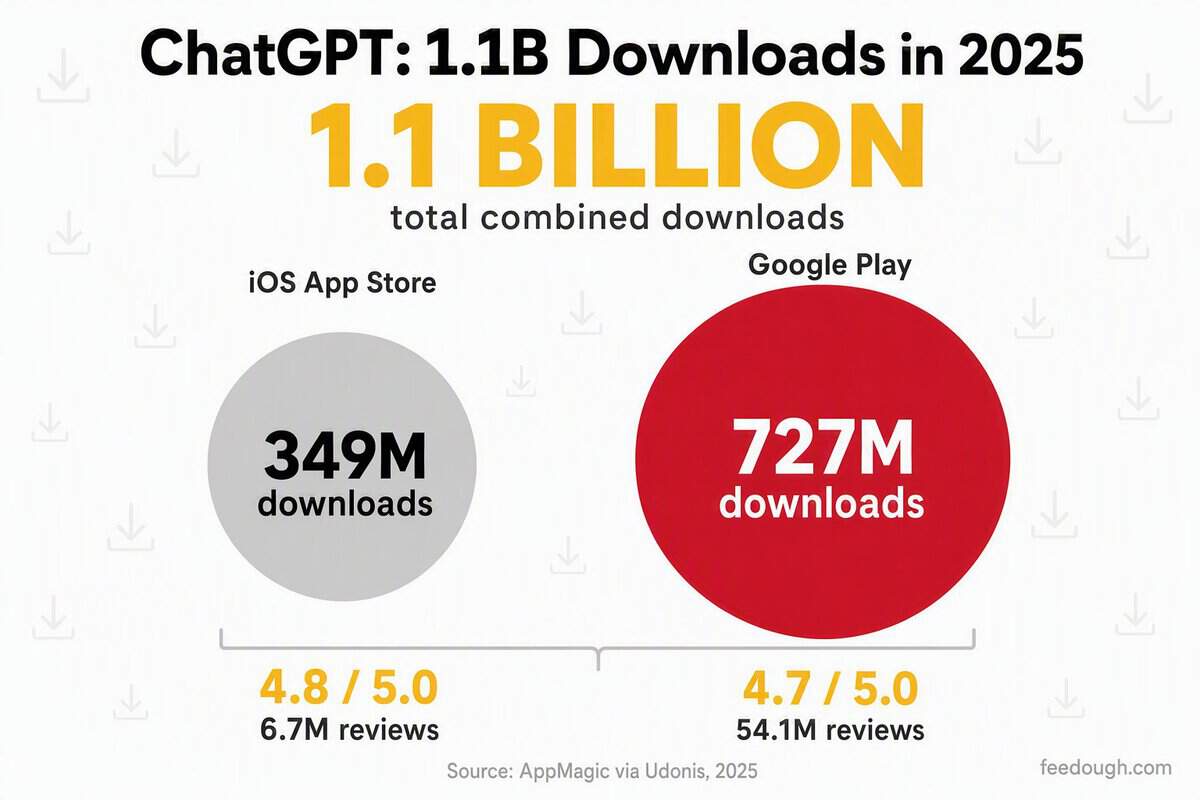
A 4.8-star rating across 6.7 million iOS reviews is unusual for any app. It is nearly unheard of for one that processed 1.1 billion downloads in a single year. ChatGPT’s 2025 app store performance combined two things most mobile platforms struggle to hold together at scale: high volume and high satisfaction.
Platform | Downloads (2025) | Rating | Total Reviews |
|---|---|---|---|
iOS App Store | 349 million | 4.8 / 5.0 | 6.7 million |
Google Play | 727 million | 4.7 / 5.0 | 54.1 million |
Combined | 1.1 billion | — | 60.8 million |
Downloads grew 219% year over year. The competitive gap widened into 2026. ChatGPT recorded 363 million downloads in the first five months, ahead of TikTok (249 million) and Google Gemini (222 million). All-time downloads since launch surpassed 1.92 billion by mid-2026.
ChatGPT Mobile Engagement and Global Usage Statistics
Non-English speakers now represent more than 50% of ChatGPT’s active users. Spanish, Portuguese, and Arabic lead the non-English languages. Three years in, the platform’s center of gravity has moved away from the English-speaking markets that built it.
India accounts for 13.7% of all mobile downloads, surpassing the United States at 10.3%. But the fastest growth is not coming from either country. Africa and Asia recorded the steepest increases in weekly active users from their regional baselines, and countries with lower Human Development Index scores expanded faster from earlier starting points.
Metric | Value | Context |
|---|---|---|
Non-English active users | >50% | Spanish, Portuguese, Arabic leading |
India (downloads) | 13.7% | Largest single download market |
United States (downloads) | 10.3% | Second-largest; delivers 38% of revenue |
Africa & Asia (weekly active growth) | Fastest relative | Expanding faster from lower baselines |
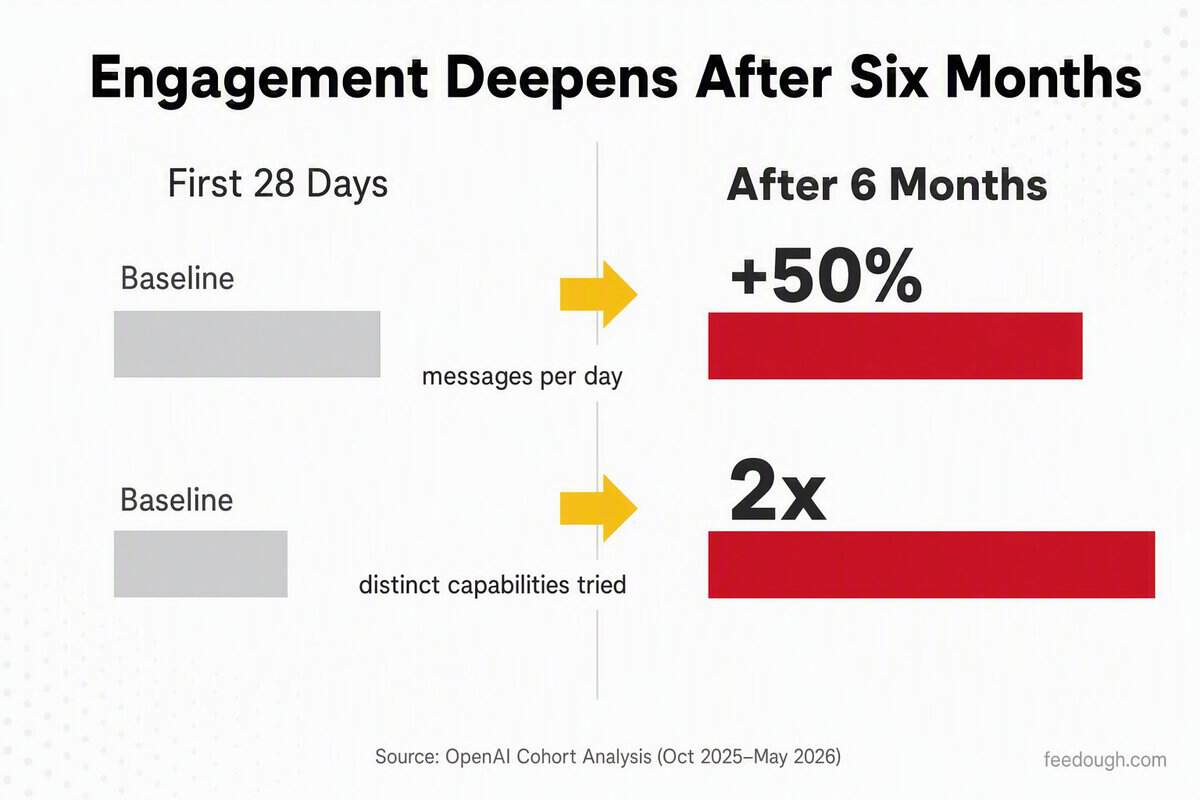
The geographic shift is not just about where people download the app. Engagement compounds over time. An OpenAI cohort analysis of accounts created between October 2025 and May 2026 found:
- After 6 months, users send 50% more messages per day compared to their first 28 days
- They have tried twice as many distinct capabilities by the six-month mark
Mobile ChatGPT usage does not stay flat after the first month. It accelerates. Users who remain for six months do not just send more messages; they explore features they never touched in the first four weeks. The pattern holds across markets, which means OpenAI’s engagement challenge is not getting people to try the app. It is keeping them long enough for the product to become habitual.
ChatGPT User Demographics and Behavior Statistics
The ChatGPT user demographics in early 2026 do not match the stereotype anyone held two years ago. Women now account for 46% of users, up from 37% in January 2024. The platform has 193 million daily active users, and adoption has spread across every adult age group.
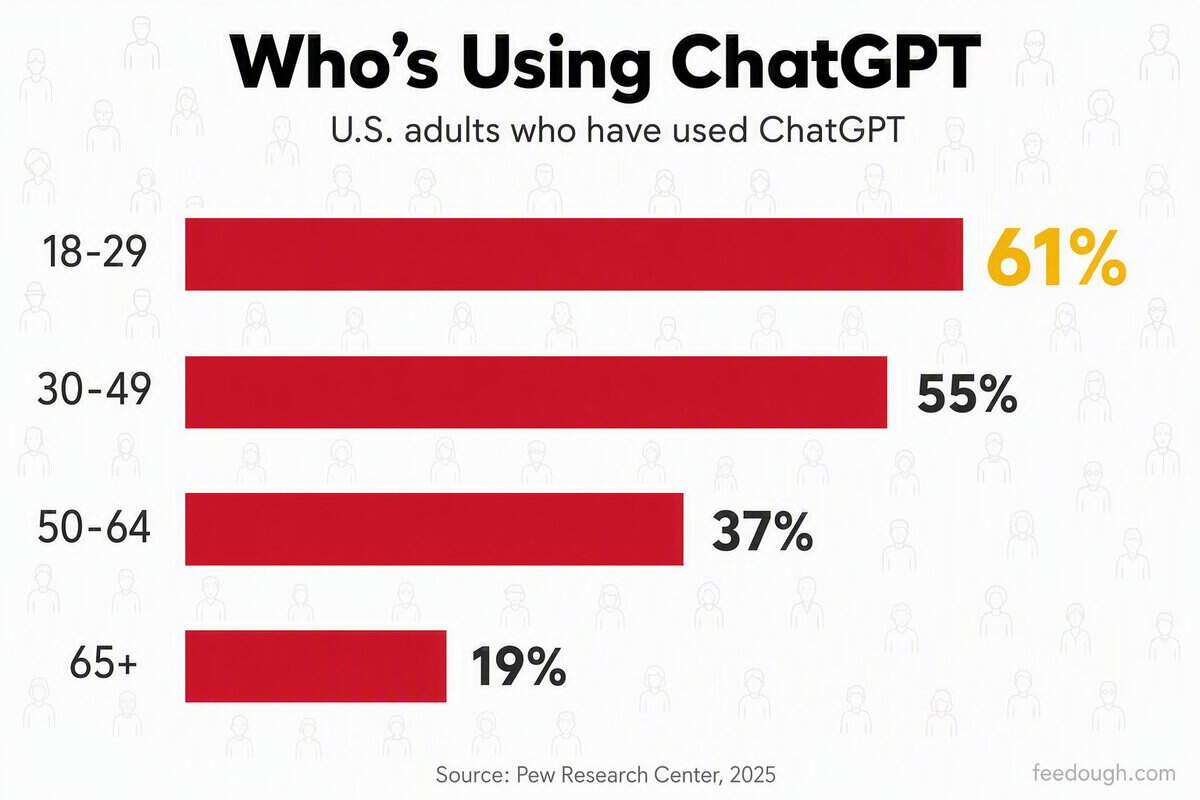
Age Group (U.S.) | Have Used ChatGPT | Source |
|---|---|---|
18–29 | 61% | Pew Research Center, 2025 |
30–49 | 55% | Pew Research Center, 2025 |
50–64 | 37% | Pew Research Center, 2025 |
65+ | 19% | Pew Research Center, 2025 |
- 46.7% of global users are aged 18 to 24, nearly double Google’s 24.7% share for the same cohort
- 26% of U.S. teens aged 13 to 17 used ChatGPT for schoolwork in 2025, doubling from 13% in 2023
- 36% of rural users are over 45, versus 18% in urban areas, reflecting different adoption curves by geography
- 56% of daily active users return to the platform more than once per day
The geographic engagement patterns confirm these are not uniform trends. Denmark leads in habitual use at 15.2% of users active daily. Japan shows the opposite pattern: 57.2% monthly adoption but just 7.1% daily, a cycle of trial without routine.
ChatGPT Age and Gender Demographics Statistics
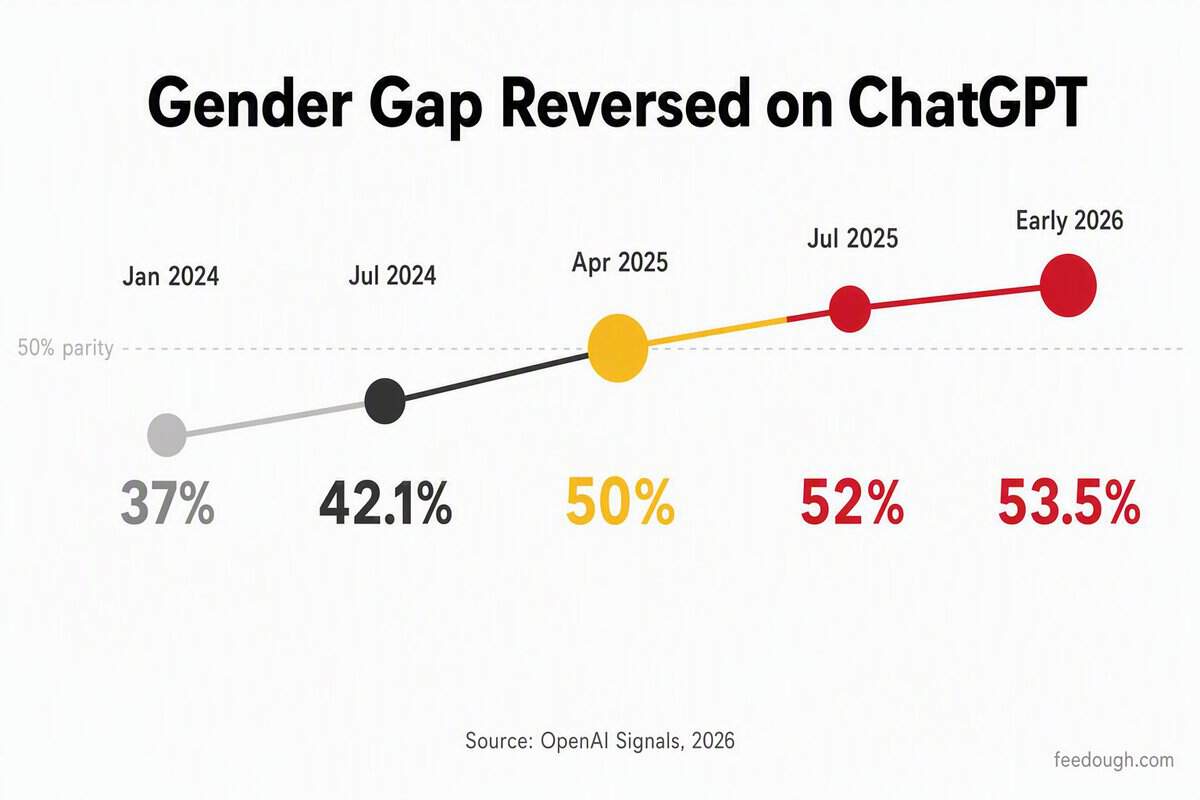
The gender gap in ChatGPT usage did not just close. It reversed. OpenAI’s analysis found that accounts with feminine names went from sending 37% of messages in January 2024 to 53.5% by early 2026. The shift took under two years.
Period | Feminine-Name Messages | Change from Baseline |
|---|---|---|
January 2024 | 37.0% | Baseline |
July 2024 | 42.1% | +5.1 pp |
April 2025 | 50.0% | Parity reached |
July 2025 | 52.0% | Female majority |
Early 2026 | 53.5% | +16.5 pp |
The reversal traces directly to use-case expansion. OpenAI’s NBER study (September 2025) found that users with feminine names gravitate toward writing, content drafting, and practical guidance. Those with masculine names lean toward technical help and multimedia. As ChatGPT expanded into personal planning and everyday problem-solving, it activated the exact use cases that pulled in a broader audience.
The age profile is shifting along the same axis, just more quietly. Message data from March 2026 shows the 25–34 cohort sending the largest share at 35.8% of all messages. 18–24 follows at 30.3%, with 35–44 at 18.6%. The trend matters more than the snapshot. The 18–24 share fell from 36.1% to 30.3% in under a year. The 35–44 cohort rose from 15.8% to 18.6%, and 45–54 climbed from 7.0% to 9.1%. Younger users still favor personal queries while older users lean toward work tasks. ChatGPT is aging up, not because young users are leaving, but because older ones are arriving.
ChatGPT Usage by Region and Country Statistics
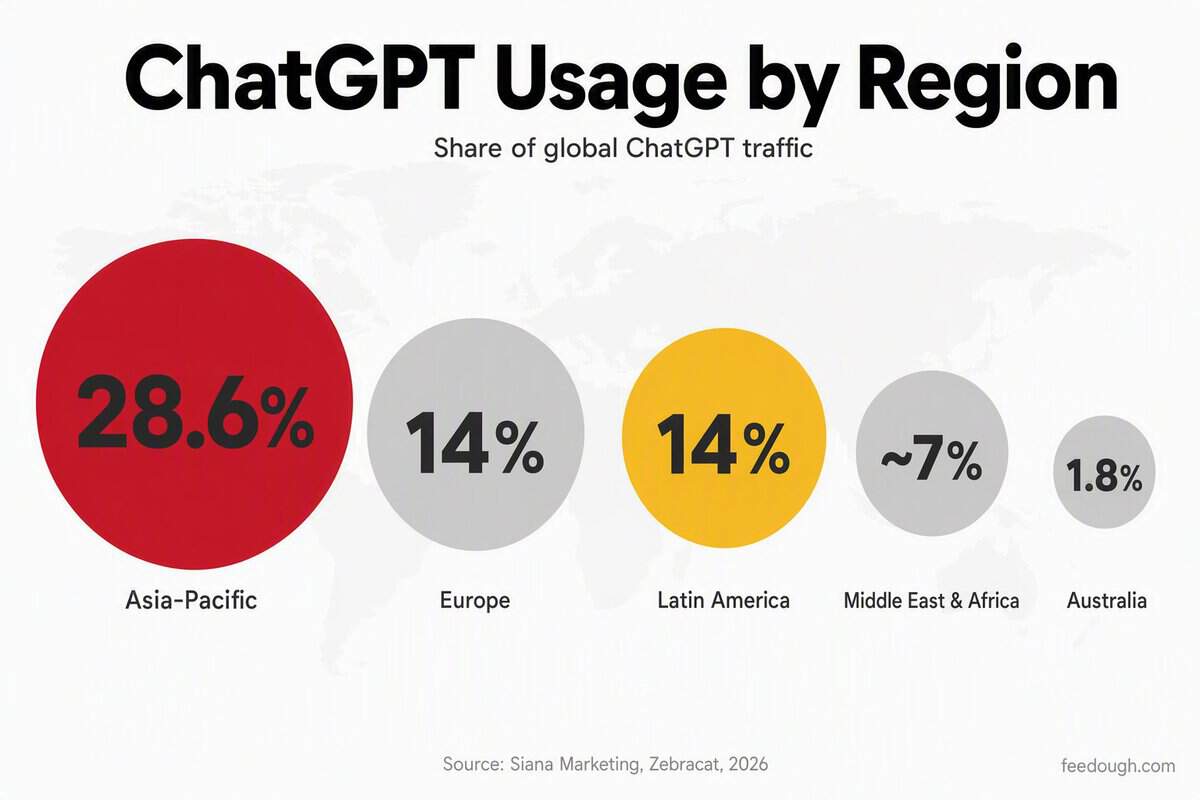
ChatGPT adoption in low- and middle-income countries is growing at more than four times the rate in the wealthiest nations. Asia-Pacific now accounts for 28.6% of all global traffic, generating 1.66 billion monthly visits. Latin America doubled its regional share from 7% to 14% in the same period.
Region | Share of Global Traffic | Key Signal |
|---|---|---|
Asia-Pacific | 28.6% | 1.66 billion monthly visits; led by India, Japan, Indonesia, Philippines |
Europe | ~14% | Mature market, desktop-heavy usage patterns |
Latin America | 14% | Doubled from 7% in 2023; Brazil +43% year-over-year |
Middle East & Africa | ~7% | Sub-Saharan Africa adoption hit 28%, up from 16% in 2023 |
Australia | 1.8% | 13.8 million users; 6th most visited website nationally |
Mobile now generates 61% of all ChatGPT sessions globally, up from 49% in 2024. Markets where smartphones serve as the primary computing device show the steepest adoption curves, and the country-level growth data confirms the pattern:
- 43.2% AI usage growth in South Korea, the fastest globally between H1 2025 and Q1 2026
- 36.2% growth in Thailand over the same period
- 34.1% growth in Japan, outpacing the United States at 19%
- 85% usage increase in Indonesia between Q4 2024 and Q1 2025
- Australia accounts for 1.8% of global traffic despite 0.33% of world population, with 12% of users naming AI as their primary information source
ChatGPT Business and Enterprise Adoption Statistics
The average ChatGPT Enterprise contract runs roughly $800,000 per year. The largest deals, at accounts like Walmart and JPMorgan, exceed $50 million annually. By Q1 2026, enterprise seats crossed 4 million across more than 5,000 customers.
Company | Seats | Estimated Annual Value | Primary Use |
|---|---|---|---|
BBVA | 120,000 | Multi-year partnership | Operations across 25 countries |
PwC | 100,000+ | ~$180M | Audit, advisory, reporting |
Morgan Stanley | 16,000+ | ~$48M | Wealth management research |
Coca-Cola | Enterprise-wide | ~$35M | Marketing, supply chain |
Klarna | Company-wide | ~$12M | Customer service, marketing |
OpenAI’s enterprise ARR reached approximately $4.8 billion, representing 38% of total company revenue. Custom GPTs in enterprise grew 19x during 2025 and now account for roughly 20% of all enterprise messages. BBVA alone runs over 4,000 custom GPTs, having expanded from an 11,000-user pilot to all 120,000 employees. Average reasoning tokens per organization grew 320x in 12 months, a signal of how deeply teams are embedding the tool into core workflows.
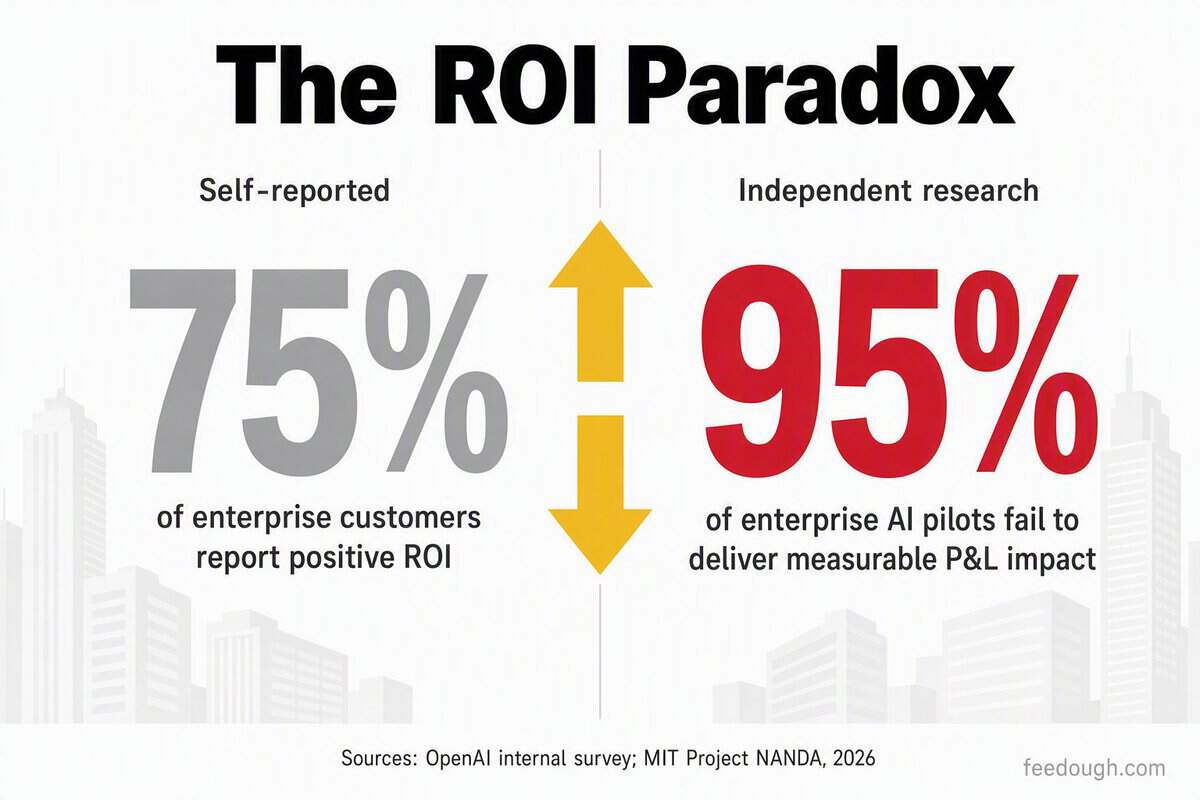
75% of enterprise customers report positive ROI. Yet MIT’s Project NANDA analysis found that 95% of enterprise generative AI pilots fail to deliver measurable P&L impact. The gap between self-reported satisfaction and hard financial measurement remains the defining tension in enterprise AI adoption today.
ChatGPT Enterprise Customer Growth Statistics
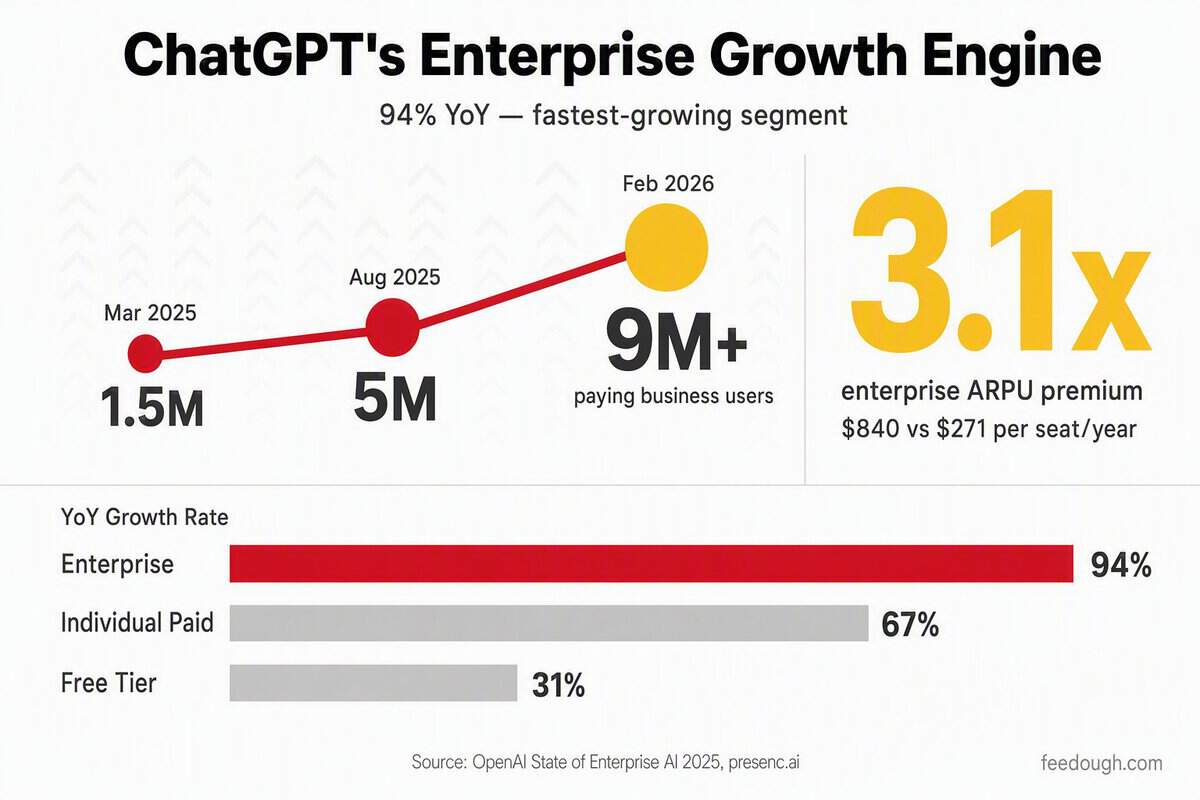
Enterprise is ChatGPT’s fastest-growing user segment, expanding at 94% year-over-year. Paid consumer subscribers grow at 67%. The free tier trails at 31%. Enterprise accounts represent roughly 11% of total users but deliver 28% of revenue, a structural imbalance that shapes every move OpenAI makes.
Metric | Enterprise | Individual Paid |
|---|---|---|
YoY Growth Rate | 94% | 67% |
Annual ARPU per Seat | $840 | $271 |
Share of User Base | ~11% | — |
Share of Revenue | 28% | — |
ARPU Premium | 3.1x | Baseline |
Each enterprise seat generates roughly 3.1 times what an individual paid subscriber produces annually. That revenue premium is the engine behind the growth trajectory, which accelerated sharply through 2025:
- 5 million paid business users by August 2025, at the time of GPT-5’s launch
- 1 million paying business customers by November 2025, a milestone OpenAI described as the fastest-growing business platform in history
- 7 million+ workplace seats and 9 million paying business users by February 2026
- 40% seat growth in just two months during 2025
Scaling from 1.5 million enterprise users to 9 million paying business users in under a year is not normal enterprise software growth. It is the kind of trajectory that forces a company to reorganize around its most valuable customers.
ChatGPT Adoption by Profession and Industry Statistics
Three professions cluster within two percentage points on ChatGPT adoption: marketing at 65%, journalism at 64%, software development at 63%. That tight grouping disguises a much wider spread inside organizations, where adoption varies by business function and by sector.
AI Adoption Context | Rate | Period |
|---|---|---|
Any AI, at least one business function | 88% | 2026 |
Generative AI specifically | 72% | 2026 |
Generative AI (two years earlier) | 33% | 2024 |
Sales & Marketing function | 52% | 2025–2026 |
Strategy function | 45% | 2025–2026 |
IT function | 41% | 2025–2026 |
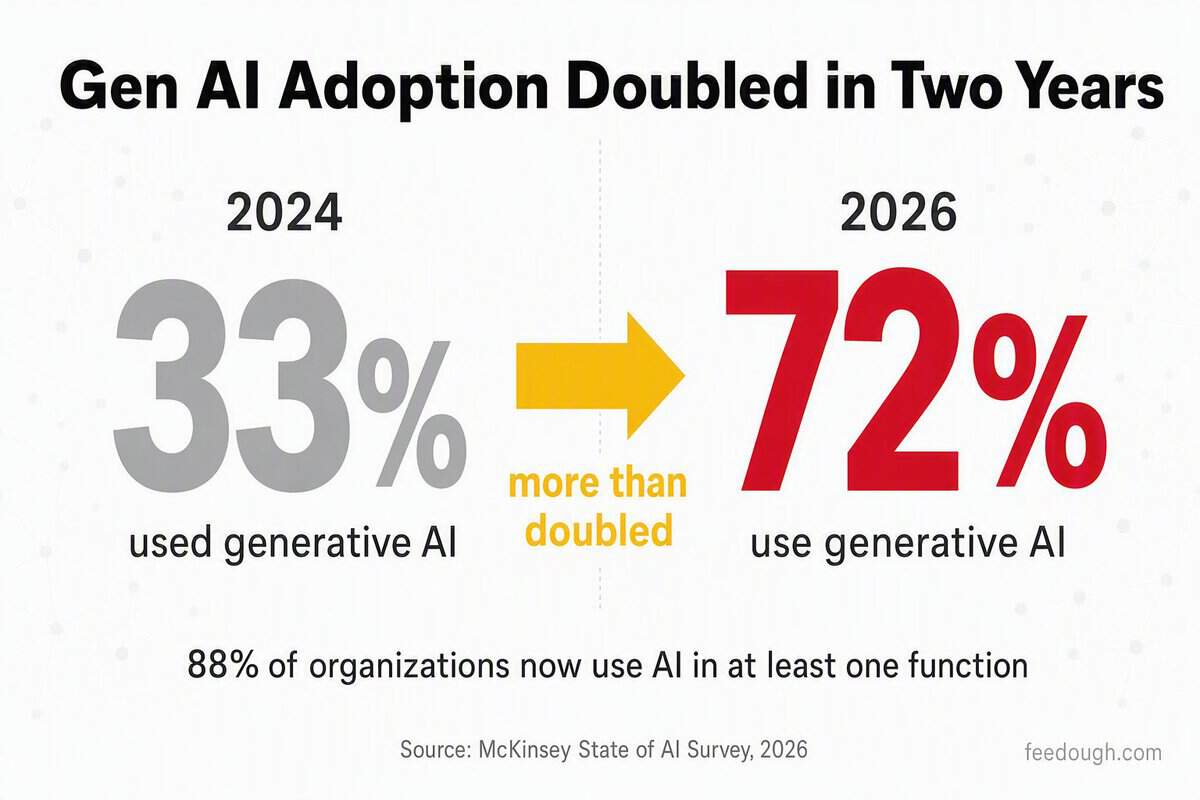
88% of organizations now regularly use AI in at least one business function, according to McKinsey’s 2026 State of AI survey. 72% specifically use generative AI, more than double the 33% recorded two years earlier. Within those organizations, adoption concentrates unevenly. The U.S. Census Bureau found Sales and Marketing leading at 52% among AI-using firms, nearly 11 points above IT at 41%. Industry-specific ChatGPT adoption rates split further across sectors and use cases:
- 84% of UK marketing professionals use ChatGPT at least weekly
- 71% of marketing teams use it regularly, but only 57% use it specifically for writing tasks
- 58% of companies deploy ChatGPT to personalize customer experiences
- 40 million people globally turn to ChatGPT daily for health information, with 1.6 to 1.9 million health insurance questions asked per week
- 88% of UK university students used generative AI for assessments in 2025, up from 53% the year before, with ChatGPT leading at 66% adoption among AI tools
Sources
- https://fatjoe.com/blog/chatgpt-stats (2026-07)
- https://www.omnibound.ai/blog/chatgpt-user-statistics
- https://technologychecker.io/blog/chatgpt-statistics (2026-02-27)
- https://www.instantpress.co/ai-statistics (2026-08-01)
- https://www.secondtalent.com/resources/chatgpt-statistics (2026-03-01)
- https://www.getpanto.ai/blog/chatgpt-statistics (2026-03-01)
- https://www.demandsage.com/chatgpt-statistics (2026-06-01)
- https://masterofcode.com/blog/chatgpt-statistics (2026-01-01)
- https://www.zebracat.ai/post/chatgpt-usage-statistics (2026-06-01)
- https://tech.yahoo.com/ai/chatgpt/articles/chatgpt-tops-1b-weekly-users-191537749.html (2026)
- https://sensortower.com/report/q2-2025-market-index (2025)
- https://searchengineland.com/chatgpt-900-million-weekly-active-users-470492 (2026)
- https://seoprofy.com/blog/chatgpt-statistics (2026)
- https://valueaddvc.com/blog/openai-revenue-2026-20b-arr-4b-month-path-to-profitability (2026-08-01)
- https://getairefs.com/blog/chatgpt-user-statistics (2026-08-01)
- https://aibusinessweekly.net/p/openai-statistics (2026-07-01)
- https://appfigures.com/resources/insights/chatgpt-fastest-app-5b-mobile (2026-06-02)
- https://www.blog.udonis.co/mobile-marketing/mobile-apps/chatgpt (2026-05-01)
- https://appfigures.com/resources/insights/chatgpt-ai-chatbot-revenue-rivals (2026-05-06)
- https://www.blog.udonis.co/mobile-marketing/mobile-apps/most-downloaded-mobile-apps (2026-06-01)
- https://checkthat.ai/brands/chatgpt/reviews (2026-06-01)
- https://play.google.com/store/apps/details?id=com.openai.chatgpt&hl=en_US (2026-08-01)
- https://memeburn.com/chatgpt-statistics-2026 (2026-07-21)
- https://coinpaper.com/10543/chat-gpt-mobile-app-has-brought-open-ai-nearly-2-billion-since-launch (2025-08-17)
- https://www.superlines.io/articles/chatgpt-statistics (2026)
- https://nerdynav.com/chatgpt-statistics (2026)
- https://openai.com/index/how-people-are-using-chatgpt (2025-09-15)
- https://c3.unu.edu/blog/what-over-2-5-billion-daily-messages-reveal-about-how-people-use-chatgpt (2025-09-15)
- https://thriveagency.com/news/chatgpt-usage-stats (2026-06-01)
- https://www.cnet.com/tech/services-and-software/most-people-use-chatgpt-for-personal-life-not-work-according-to-a-new-openai-study (2025-09-15)
- https://www.sianamarketing.com/resources/chatgpt-usage-by-country-2026 (2026-03-01)
- https://tech-insider.org/au/chatgpt-google-search-australia-2026 (2026-06-01)
- https://econews.com.au/report-chatgpt-enters-australias-top-10-most-visited-websites-user-prompts-reach-21b-a-year (2026-05-01)
- https://searchlab.nl/en/statistics/chatgpt-statistics-2026 (2026-03-17)
- https://aibusinessweekly.net/p/chatgpt-statistics (2026-07-31)
- https://mlq.ai/news/bbva-deploys-chatgpt-enterprise-to-120000-employees-in-multi-year-openai-partnership (2026-06-11)
- https://thunderbit.com/blog/chatgpt-adoption-statistics-business (2026-03-01)
- https://www.getpanto.ai/blog/openai-statistics (2026-03-01)
- https://presenc.ai/research/chatgpt-usage-statistics (2026-06-01)
- https://aibusinessweekly.net/p/ai-adoption-statistics (2026-07-31)
- https://www.margen.net/chatgpt-statistics-uk-2026 (2026)
- https://www.incremys.com/en/resources/blog/chatgpt-statistics (2026-03-04)
- https://www.nber.org/papers/w35141 (2026)
- https://www.kff.org/racial-equity-and-health-policy/the-growing-use-of-artificial-intelligence-in-health-care-and-implications-for-disparities (2026)
- https://www.datarefs.com/statistics/ai/ai-in-education (2025)