

OpenAI’s IPO keeps slipping while its numbers keep accelerating. The company is now leaning toward a 2027 listing, yet leadership still calls any valuation below $1 trillion a nonstarter. Both facts came out of the same year.
OpenAI statistics from 2026 show annualized recurring revenue nearing $70 billion by late September, up more than 70% since July, while ChatGPT passed 1 billion weekly active users in August. The same period produced a $12.3 billion operating loss on $6.7 billion in booked Q2 revenue.
Here is where the revenue is coming from, how fast the user base is scaling, and what the path to profitability actually requires.
Key OpenAI Statistics for 2026
OpenAI’s 2026 numbers tell two stories at once: a commercial business compounding faster than any software company in history, and a consumer app surrendering U.S. market share. Here are the figures that define where it stands.
- 1.2 billion weekly users globally as of September 2026, up from 900 million in February 2026, per OpenAI data reported by Exploding Topics
- $50 billion in annualized revenue by the end of September 2026, with company guidance targeting $70 billion by year-end, per Bloomberg
- $852 billion valuation holding flat through a $7 billion employee tender offer completed August 10, 2026, with a new private round under negotiation that could value OpenAI as high as $1.5 trillion, per Fortune
- $122 billion raised in March 2026, the largest private tech funding round on record
- $190 billion in total funding received as of 2026, per gradually.ai
- 1 million+ business customers worldwide using OpenAI products, confirmed by OpenAI in November 2025
- 2.8 billion daily queries processed globally as of Q1 2026, a 75% increase from 1.6 billion a year earlier, per Presenc AI research
- 36.5% of U.S. businesses had adopted OpenAI services by July 2025
- Below 40% daily active user share among the top seven U.S. gen AI chatbot apps in March 2026, continuing the slide from 45.3% in January, per Apptopia
- 330 million daily queries from U.S. users alone, roughly 13% of global volume at the time of measurement
- 49% of U.S. companies report using ChatGPT regularly in their workflows, per a ResumeBuilder/Digital Silk survey
- ChatGPT adoption growth rates in the lowest-income countries ran more than 4x those in the highest-income countries by May 2025, according to OpenAI’s own research
OpenAI Revenue and Financial Performance Statistics
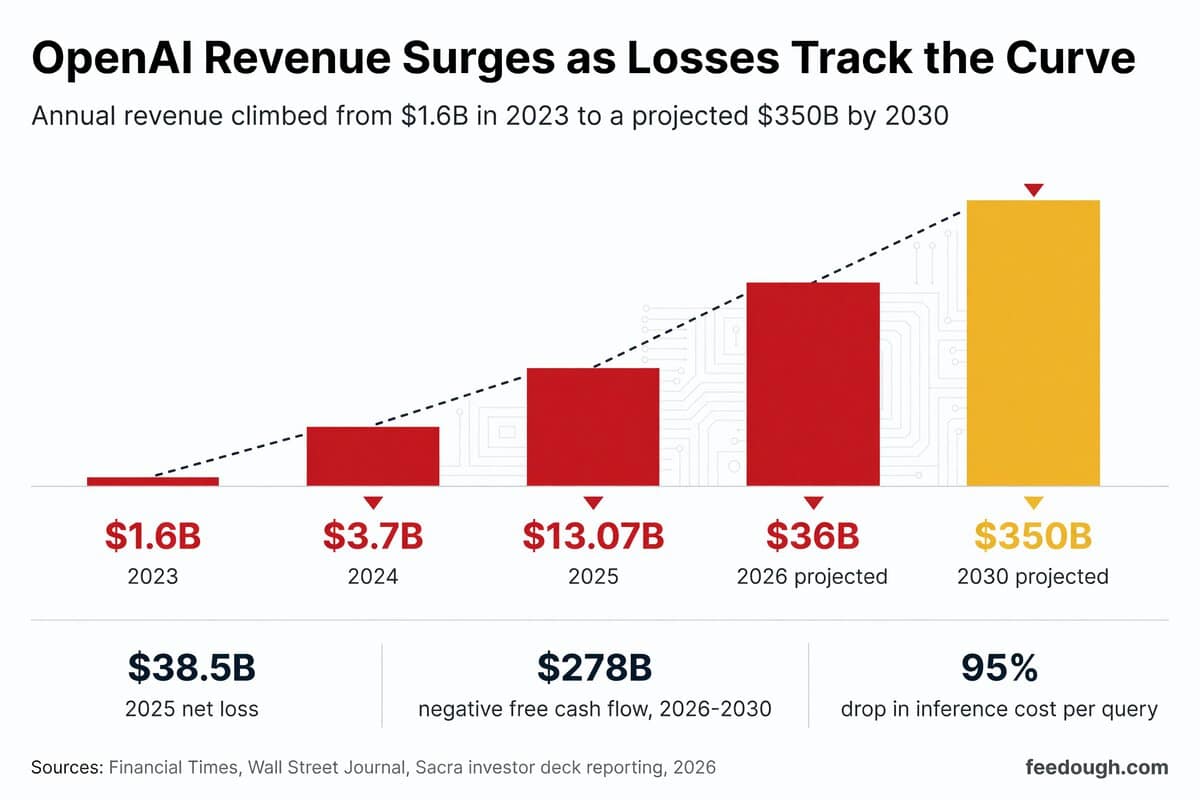
OpenAI’s revenue grew from $1.6 billion in 2023 to $13.07 billion in 2025, and a September 2026 investor deck reported by the Financial Times projects $36 billion for 2026 and $350 billion by 2030. OpenAI revenue statistics from the same deck describe a cost base climbing at nearly the same slope.
Period | Revenue | Bottom Line |
|---|---|---|
Full-year 2023 | $1.6 billion | ARR hit $2 billion by year-end |
Full-year 2024 | $3.7 billion | Net loss of roughly $5 billion |
Full-year 2025 | $13.07 billion | $20.92 billion operating loss; audited net loss of $38.5 billion |
Full-year 2026 (projected) | $36 billion | Q1 operating loss already $9.3 billion including stock-based compensation |
Full-year 2030 (projected) | $350 billion | Within $840 billion of cumulative revenue projected for 2026 through 2030 |
The audited 2025 statements, leaked in June 2026 and verified by the Financial Times and Fortune, put the net loss at $38.5 billion, well above the $20.92 billion operating loss. Roughly $41.55 billion of that came from a one-time, non-cash charge tied to the nonprofit-to-for-profit conversion. Underlying spending stayed steep regardless: $19.18 billion in research and development and $5.73 billion in sales and marketing.
The quarterly numbers underline the point. OpenAI burned $3.7 billion of cash in Q1 2026 while booking $5.7 billion of revenue, and its operating loss including stock-based compensation reached $9.3 billion that quarter, per the Wall Street Journal. Losses are tracking the growth curve rather than shrinking against it.
The composition of that revenue is shifting faster than the topline suggests. CFO Sarah Friar said at Davos in January 2026 that consumer subscriptions produced about 70% of 2025 revenue (roughly $9.1 billion) against $3.9 billion from enterprise contracts and APIs. Enterprise crossed 40% of the mix by early 2026 and reportedly overtook consumer revenue in August. By then, the annualized run rate looked like this:
- ChatGPT subscriptions: $22 billion of roughly $40 billion in annualized recurring revenue, from more than 50 million paid subscribers
- API consumption: $12 billion annualized
- Sora, licensing, and ads: $6 billion annualized, with the ads business alone crossing a $1 billion run rate by August 31, 2026
The September deck also rewrote the cash math. The earlier plan projected roughly $44 billion of cumulative losses through 2029; the new one projects $278 billion of negative free cash flow from 2026 through 2030, alongside about $856 billion in compute and infrastructure spending. The $122 billion raised in March 2026 is on track to run out by 2028. Cost per unit is falling even as total cost climbs: inference spending reached $8.67 billion in the first three quarters of 2025 alone (up from $3.76 billion for all of 2024), and Sacra projects $14.1 billion for full-year 2026. Adjusted gross margin still recovered from 33% in 2025 to about 39% by Q1 2026, helped by a 95% drop in inference cost per query since GPT-4 launched.
OpenAI Valuation and Funding Round Statistics
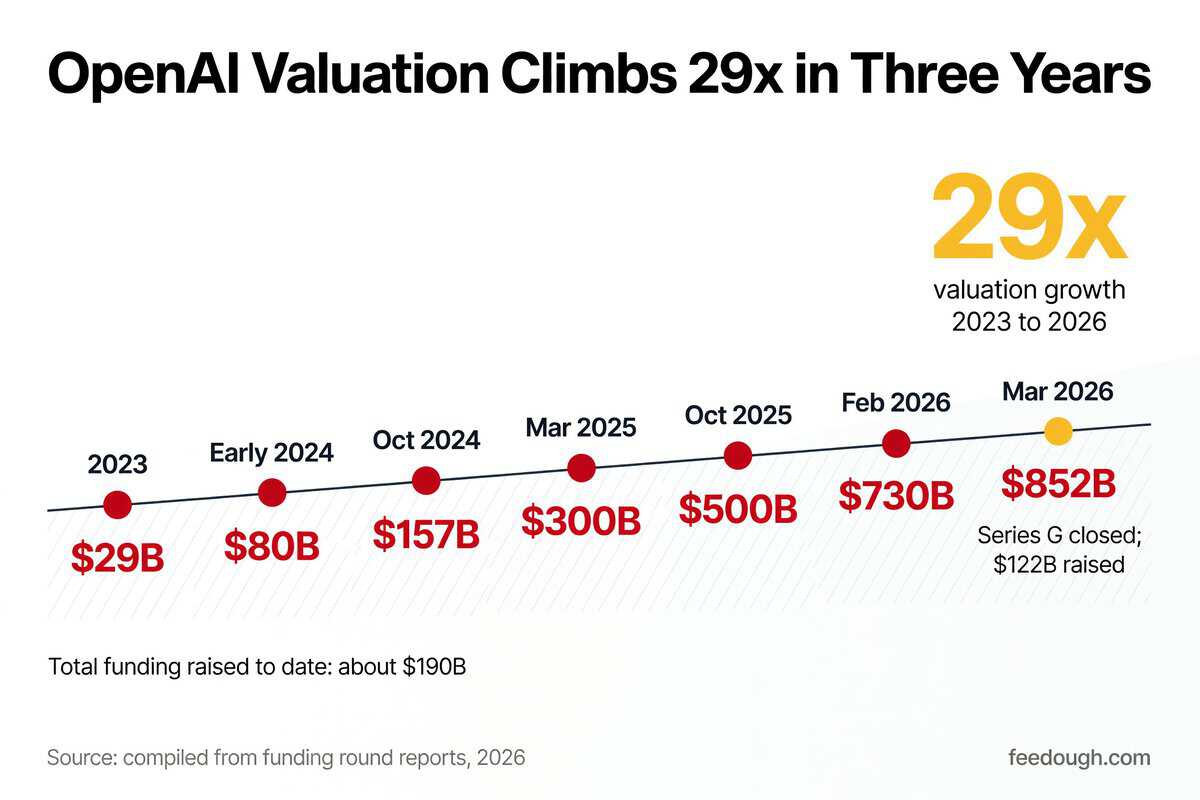
OpenAI’s $122 billion Series G closed on March 31, 2026 at an $852 billion post-money valuation, the largest single private funding round in history. The round had been announced five weeks earlier at a $110 billion target and a $730 billion pre-money valuation. It grew by $12 billion before the papers signed.
OpenAI’s valuation and funding round statistics since 2023 chart a 29x climb in roughly three years, from $29 billion in a Thrive Capital-led tender offer to $852 billion at the Series G close. Total funding across all rounds now stands at approximately $190 billion.
Date | Valuation | Round / Event |
|---|---|---|
2023 | $29 billion | Thrive Capital-led tender offer |
Early 2024 | $80 billion | Secondary share transaction |
October 2024 | $157 billion | Series E funding round |
March 2025 | $300 billion | Series F; $40 billion raised, led by SoftBank ($30 billion) |
October 2025 | $500 billion | Secondary share sale; surpassed SpaceX as most valuable private company |
February 2026 | $730 billion (pre-money) | Series G announced with a $110 billion target |
March 2026 | $852 billion | Series G closed; $122 billion raised, anchored by Amazon ($50 billion) |
The composition of the round matters as much as its size. Each piece of the March announcement was built to do a specific job:
- $50 billion from Amazon, split between $15 billion funded at closing and $35 billion contingent on an IPO or an as-yet-undefined AGI milestone
- $100 billion added to OpenAI’s AWS compute agreement over eight years, on top of a prior $38 billion deal, with AWS named exclusive cloud distributor for the Frontier enterprise platform
- $30 billion each from Nvidia and SoftBank, with a16z, D.E. Shaw, Fidelity, Sequoia, Thrive Capital, BlackRock, Blackstone, Temasek, and T. Rowe Price also participating
- $3 billion from individual investors through private-bank channels at a $500,000 minimum, roughly 3x oversubscribed against more than $9 billion in demand
- $240 million placed with ARK Invest across three ETFs at about 3% of each portfolio, the first public-fund route into OpenAI shares
- $4.7 billion revolving credit facility, undrawn, backed by JPMorgan Chase, Goldman Sachs, Morgan Stanley, Wells Fargo, and Citi
The $35 billion Amazon contingency is the term to watch. That capital materializes only if OpenAI completes an IPO or hits a milestone the deal never defines. It is a bet on a specific exit, structured to cap downside if that exit never arrives. The retail allocation was drafted the same way: non-voting Series F preferreds converting one-for-one in any future IPO. OpenAI filed a draft Form S-1 confidentially with the SEC on June 8, 2026. Goldman Sachs, Morgan Stanley, Citi, and JPMorgan Chase are reportedly serving as lead underwriters.
ChatGPT User Growth Statistics 2026
ChatGPT user growth statistics for 2026 open with a milestone no consumer app has matched. The app crossed 1 billion monthly active users in May, a figure Reuters confirmed in June using Sensor Tower estimates, and OpenAI reported 1 billion weekly active users by July 31, roughly three and a half years after launch. It remains the fastest consumer product in history to reach that scale.
The weekly user curve has barely bent under its own weight:
Period | Weekly Active Users | Notable Context |
|---|---|---|
November 2023 | 100 million | First major weekly milestone disclosed |
March 2025 | 500 million | 5x growth in 16 months |
October 2025 | 800 million | 8x from November 2023 in under two years |
February 2026 | 900 million | Doubled from 400 million in February 2025 |
July 2026 | 1 billion+ | Confirmed by OpenAI on July 31, alongside 2 million+ corporate customers |
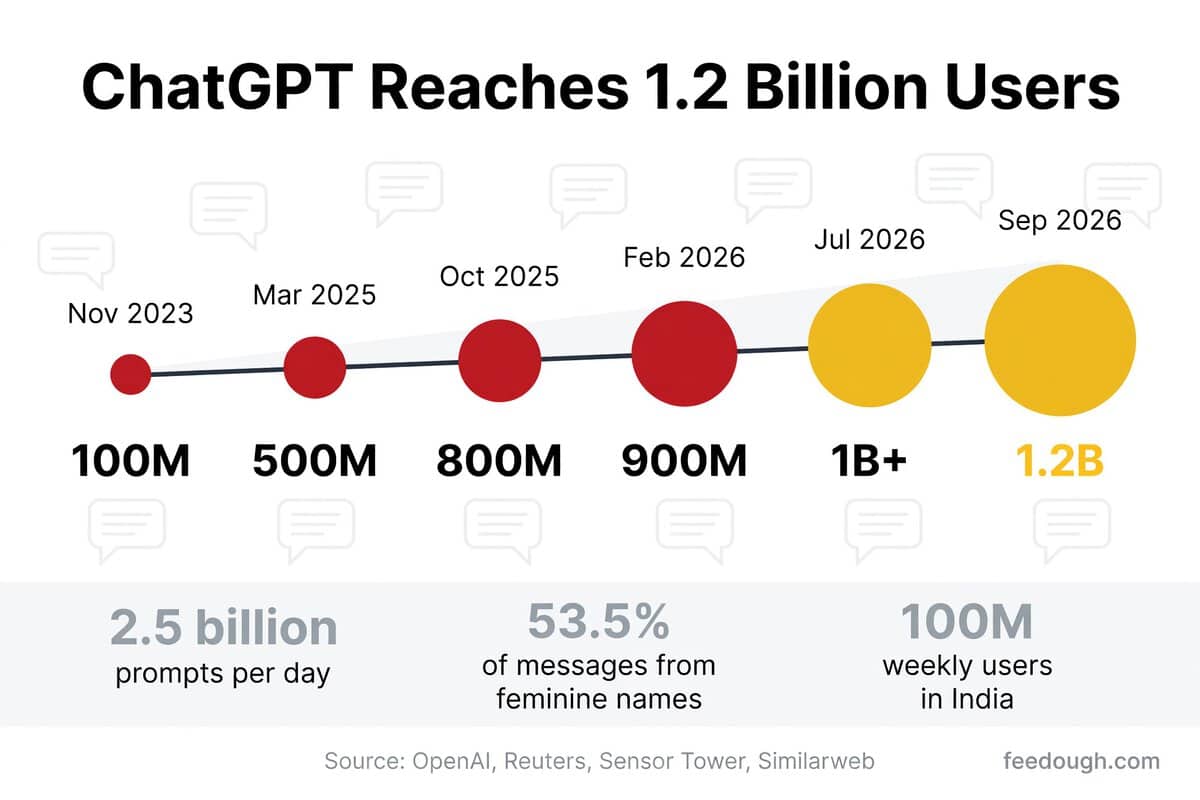
September 2026 | 1.2 billion | Per OpenAI data reported by Exploding Topics |
Who is generating all those sessions has shifted faster than the headline count suggests. By March 2026, users with typically feminine first names accounted for 53.5% of all ChatGPT messages, up from roughly 20% historically, though Similarweb’s traffic-based panel still shows a 53.08% male split among estimated users. Engagement deepened in parallel: queries per session averaged 1.75 by February 2026, up from a 2025 range of 1.16 to 1.21, per Semrush data compiled by SEOprofy. ChatGPT now handles about 2.5 billion prompts per day globally.
Geography points the same direction. India became ChatGPT’s second-largest market in early 2026, reaching 100 million weekly active users and growing 41% year over year, and 38% of daily queries now originate outside North America and Europe. The fastest adoption gains in OpenAI’s Q1 2026 Signals data came from the Dominican Republic, Haiti, and Tanzania, extending a pattern first documented in OpenAI’s September 2025 consumer usage study: growth in the lowest-income countries keeps outpacing the highest-income ones. Roughly 64% of internet users worldwide have now interacted with ChatGPT at least once in the past year.
ChatGPT Usage Statistics: How People Actually Use It
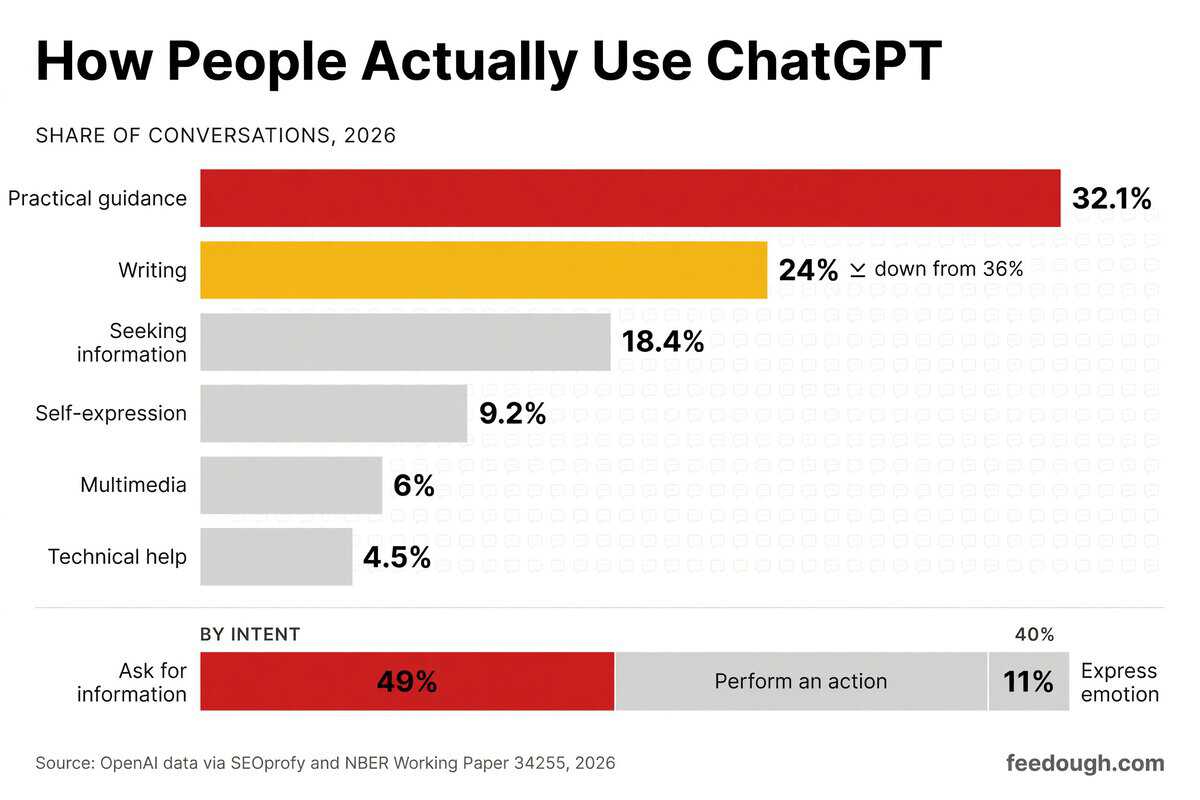
ChatGPT started as a writing tool, and its own tracking shows how quickly that changed. ChatGPT usage statistics from OpenAI’s June 2026 data put practical guidance at the top of every category, with 32.1% of conversations, per SEOprofy’s analysis. Writing fell from 36% of conversations in June 2024 to 24% a year later. Information seeking rose from 14% to 24% over the same stretch, swapping places with it. The reversal unfolded inside a volume surge: daily messages grew from 451 million to 2.6 billion over those twelve months, per OpenAI’s consumer usage study published as an NBER working paper. The current category breakdown looks like this:
Category | Share of Conversations | Change vs. Earlier Tracking |
|---|---|---|
Practical guidance | 32.1% | Up from 29% |
Writing | 24% | Down from 36% |
Seeking information | 18.4% | Up from 14% |
Self-expression | 9.2% | Added in the 2026 breakdown |
Multimedia | 6% | Added in the 2026 breakdown |
Technical help | 4.5% | Added in the 2026 breakdown |
Topic labels describe what people bring to the model, not why they bring it. By intent, 49% of messages ask for information, 40% set out to perform a specific action, and 11% express emotion, per NBER Working Paper 34255’s analysis of 1.5 million conversations. The category list itself was re-cut after that study, so shares do not map one-to-one across the two counts.
OpenAI’s original work-versus-non-work split hid part of the picture. Adding schoolwork as its own category by March 2026 showed 16.3% of usage was schoolwork, against 68.9% non-work and 19.2% work-related. Education predicts the work split better than demographics do: post-graduate degree holders send 48% of their messages as work-related, against 37% for users without a bachelor’s degree. Sessions run long by web standards too, with chatgpt.com averaging 8.2 minutes in February 2026 per Similarweb.
The audience is also moving off the open web. chatgpt.com’s share of web traffic fell from 76% to 53.9% between June 2025 and May 2026, even as monthly visits climbed to roughly 5.9 billion by September. The mobile app numbers show where the time went:
- 200 million downloads across iOS and Android over the first five months of 2026, enough to overtake TikTok and take the title of most-downloaded app of the year, per AppMagic data compiled by DemandSage and SEOprofy
- 53 million downloads in April 2026 alone, bringing total downloads since May 2023 to roughly 1.44 billion, per Statista
- $1.5 billion in net in-app purchase revenue through mid-2026, second only to TikTok, with Claude generating $163 million over the same period, per Digital Information World
- $227 million in mobile revenue in February 2026, per Appfigures and Statista data compiled by SEOprofy
OpenAI Website Traffic Statistics: openai.com vs. chatgpt.com
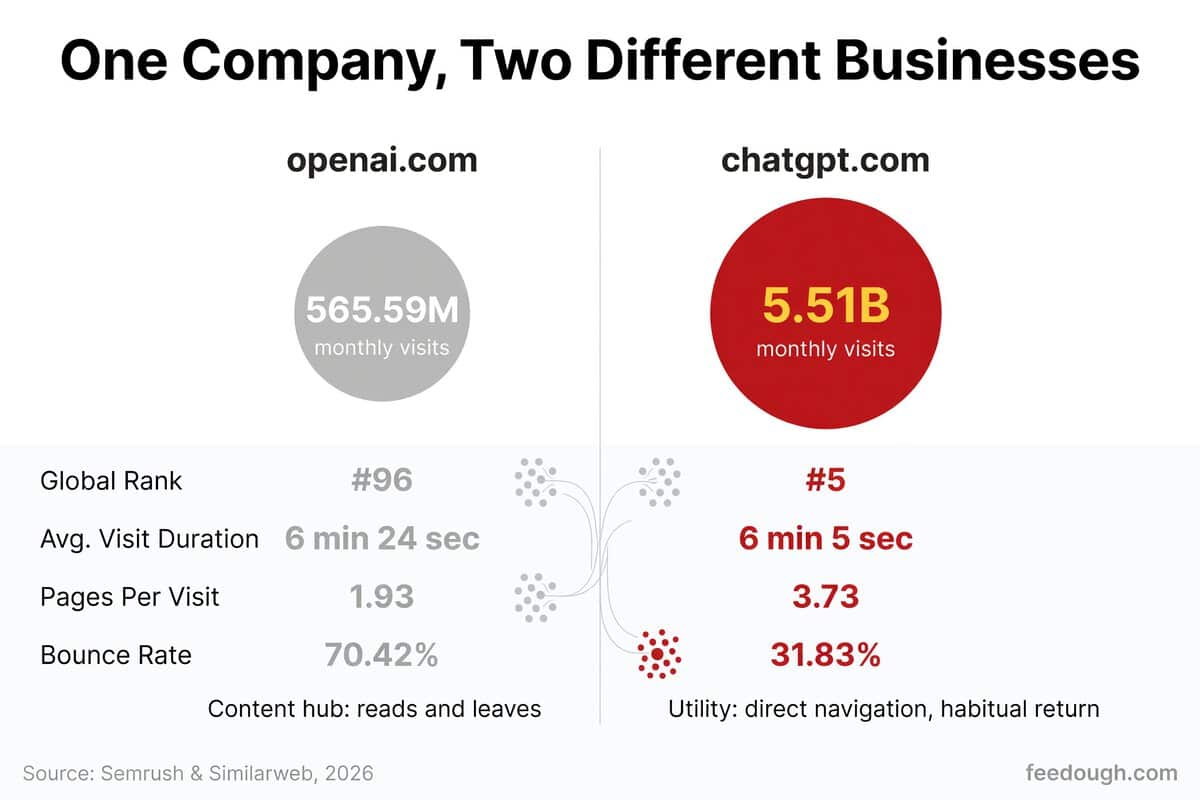
OpenAI website traffic statistics for August 2026 show a gap wider than it was at the start of the year. chatgpt.com drew 5.51 billion visits in April, ranking fifth among all websites globally, while openai.com pulled in 565.59 million and slid to #96, per Semrush data updated September 17, 2026. The two domains belong to the same company. They behave like different businesses.
Metric | openai.com | chatgpt.com |
|---|---|---|
Monthly visits | 565.59 million (August 2026) | 5.51 billion (April 2026) |
Global website rank | #96 | #5 |
Avg. visit duration | 6 min 24 sec | 6 min 5 sec |
Pages per visit | 1.93 | 3.73 |
Bounce rate | 70.42% | 31.83% |
Primary traffic pattern | Social referrals, led by YouTube | Direct navigation (76% of desktop) |
The engagement split is the tell. openai.com now holds visitors longer than it did earlier in the year, but pages per visit fell to 1.93 and the bounce rate climbed to 70.42%. That is the profile of a content hub: someone lands on a blog post or news item, reads it, and leaves. chatgpt.com looks like a utility. Nearly three-quarters of its desktop traffic arrives through direct navigation, the signature of habitual return use, and Similarweb counted 467 million monthly unique visitors worldwide between March and May 2026 (up 45% year over year). One domain publishes. The other delivers.
ChatGPT User Demographics Statistics by Age and Education
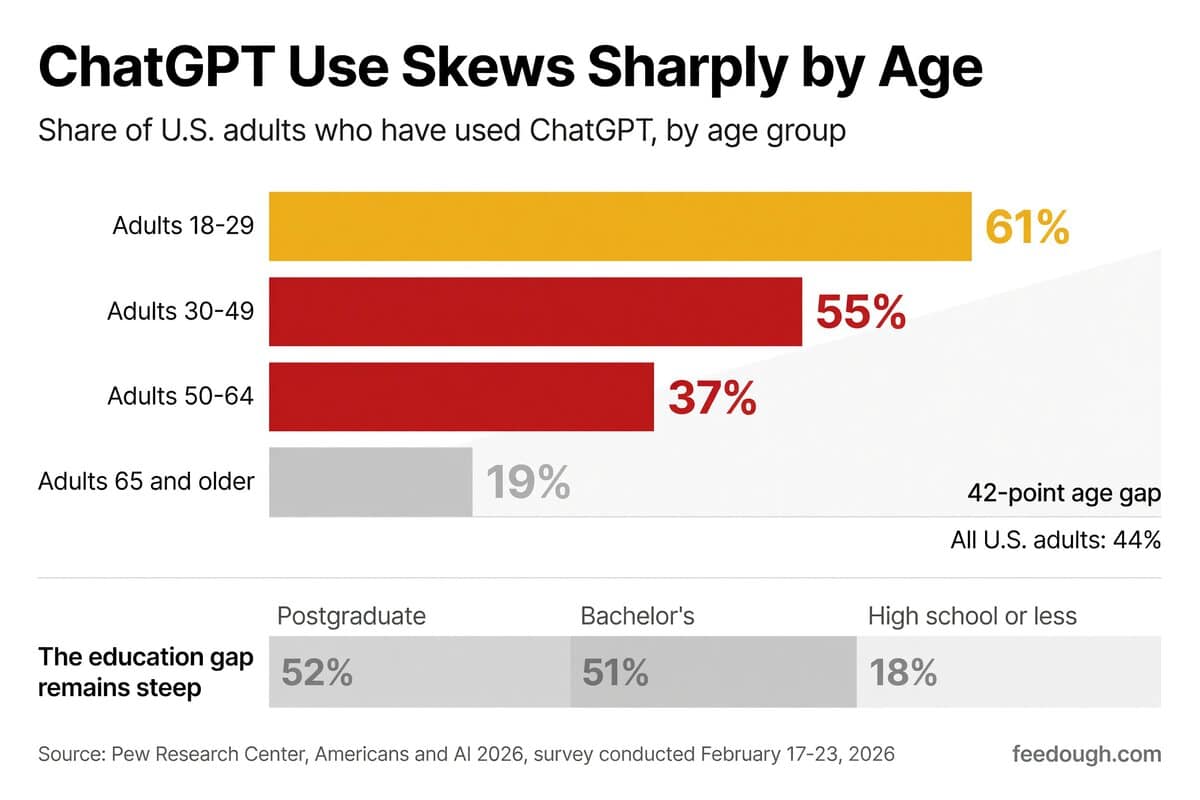
ChatGPT user demographics in the U.S. still tilt young, but age has overtaken education as the sharpest divide in the data. Pew Research Center’s February 2026 survey found 61% of adults ages 18-29 have used ChatGPT, against just 19% of adults 65 and older. That 42-point spread now exceeds the education gap measured a year earlier. Overall U.S. adult usage reached 44%, more than double the 18% recorded in 2023, and the platform’s earliest profile of young, male, English-speaking tech workers no longer describes who is showing up.
Age Group | % Who Have Used ChatGPT |
|---|---|
Adults 18-29 | 61% |
Adults 30-49 | 55% |
Adults 50-64 | 37% |
Adults 65 and older | 19% |
All U.S. adults | 44% |
Source: Pew Research Center’s Americans and AI 2026 report, survey conducted February 17-23, 2026.
The education gradient remains steep where it has been measured. Postgraduate degree holders (52%) and bachelor’s degree holders (51%) use ChatGPT at nearly three times the rate of adults with a high school education or less (18%), per Pew’s February 2025 survey. One caveat matters: Pew’s 2026 report does not break chatbot use out by education level, so those figures are a year old. Age appears to compress the education gap at the younger end of the distribution, where nearly half of all ChatGPT messages from adults come from users under 26, per OpenAI’s September 2025 NBER consumer usage study.
The rest of the demographic picture has moved just as fast:
- 26% of U.S. teens ages 13-17 use ChatGPT for schoolwork, double the 13% reported in 2023, per Pew Research Center’s December 2025 teen survey
- 59% of teens have used ChatGPT at all, with roughly 3 in 10 using AI chatbots on a daily basis
- 53.84% of ChatGPT’s earliest users were male; by mid-2025 that split had reversed, with women forming the majority, per OpenAI’s NBER study
- 62% of college students report using ChatGPT weekly, alongside 41% of freelancers in writing, design, and development fields
- 2.1x more likely to access ChatGPT on desktop for users aged 35 and older compared with those aged 18-24, a device divide that tracks the age split
These shifts sit inside a broader move: 49% of U.S. adults now use AI chatbots like ChatGPT, Gemini, or Copilot, up from 33% in 2024, and 24% use one daily, per Pew’s February 2026 survey of 5,119 U.S. adults. ChatGPT’s reach extends to 161+ countries and 95 languages, with 32% of global users based in Asia, the largest regional concentration. The education divide persists, but it is narrowing as younger and more international cohorts join at higher rates.
OpenAI GPT-5 API Pricing Statistics by Model Tier
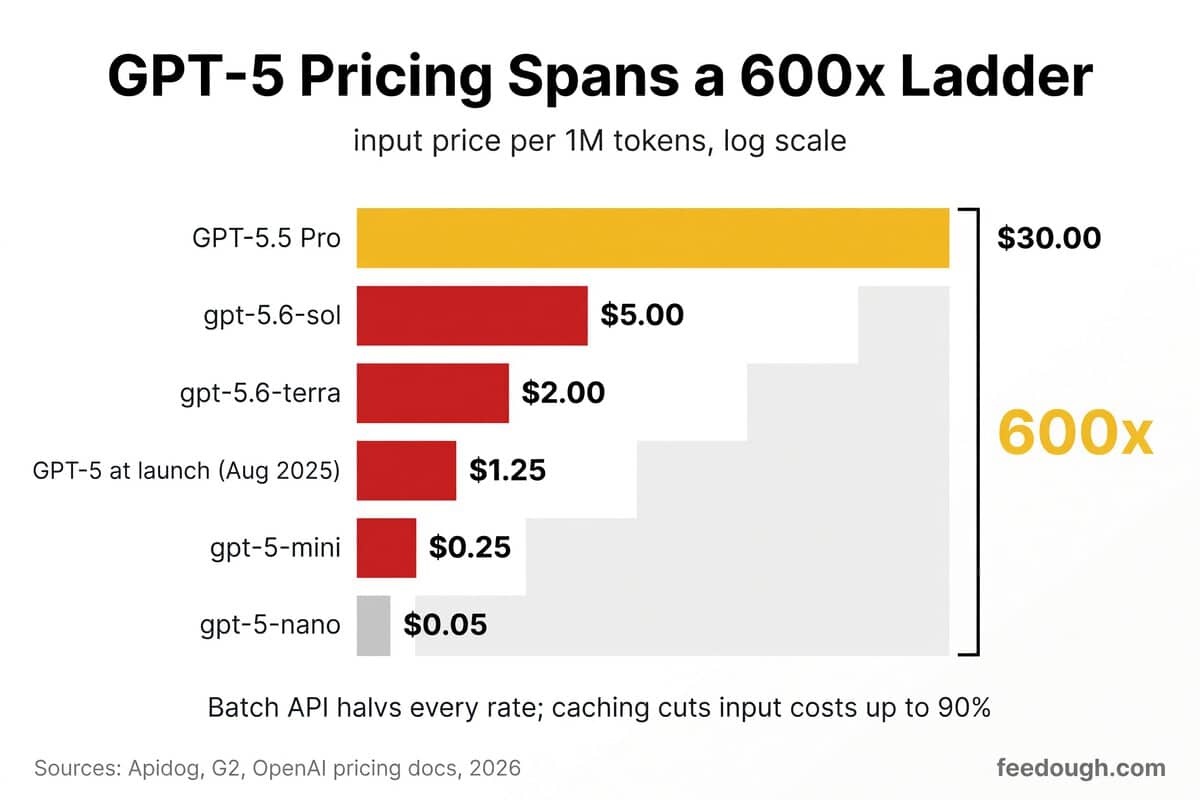
OpenAI’s GPT-5 API pricing now spans a 600x range, from $0.05 per million input tokens on gpt-5-nano to $30.00 on GPT-5.5 Pro. When GPT-5 launched in August 2025 at $1.25, it undercut every frontier model on the market. OpenAI halved that price to $0.625 by May 2026, while releasing newer models at two to four times the original rate. The gap between cheapest and most expensive widened from 100x to roughly 600x in under a year. The current ladder looks like this:
Model / Tier | Input (per 1M tokens) | Output (per 1M tokens) | Role in the Ladder |
|---|---|---|---|
gpt-5-nano | $0.05 | $0.40 | Floor; summarization and classification |
gpt-5-mini | $0.25 | $2.00 | 80% less output cost than the original flagship |
GPT-5 at launch (Aug 2025) | $1.25 | $10.00 | Undercut every frontier model at release |
gpt-5.6-terra | $2.00 | $12.00 | Mid-tier of the GPT-5.6 series, launched August 2026 |
gpt-5.6-sol | $5.00 | $30.00 | Top standard model of the GPT-5.6 series |
GPT-5.5 Pro | $30.00 | $180.00 | Ceiling; 1M-token context window |
The list prices are a ceiling, not what most developers pay. OpenAI’s Batch API halves every standard rate, dropping GPT-5.5 to $2.50 per million input and $15.00 output. Prompt caching cuts repeated input costs by up to 90% on top of that. Mid-cycle variants add cheaper rungs below the flagship as well, with gpt-5.4-mini at $0.75 input and gpt-5.4-nano at $0.20. Those discounts are what make the volume work, and the volume is what generates the compute bill. OpenAI paid Microsoft $17.2 billion for Azure compute in 2025, more than it booked in revenue that year. It became Microsoft’s largest Azure customer on $12.43 billion of Azure inference infrastructure between calendar year 2024 and the third quarter of 2025. The price compression at the bottom drives adoption. The premium tiers at the top pay for it.
ChatGPT Referral Traffic Statistics: Conversion Rates and Routing
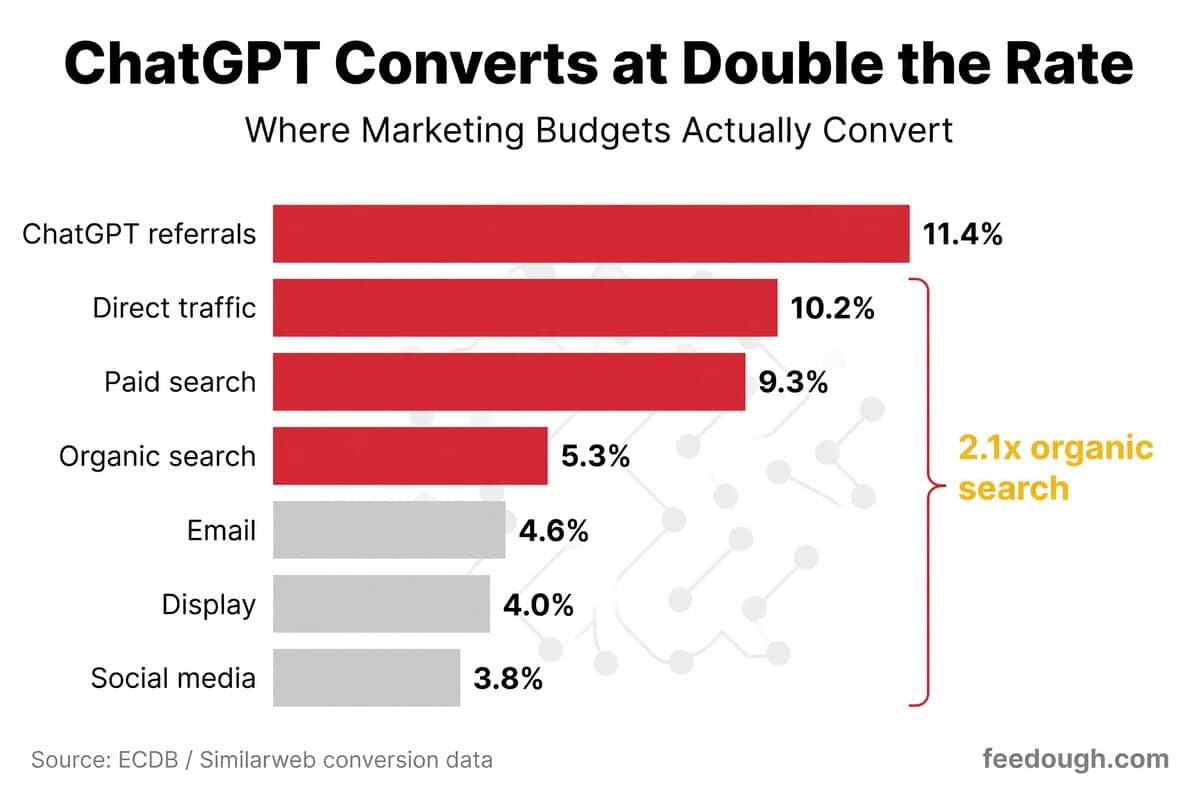
Most marketing budgets still flow to organic search. ChatGPT-referred visitors convert at 11.4%, more than double organic search’s 5.3%, per ECDB research using Similarweb conversion data. Adobe Digital Insights found AI-referred visitors converting 31% better than non-AI traffic in January 2026, spending 68% more time on site and bouncing 33% less.
Google still sends more raw traffic, but ChatGPT visitors behave differently once they arrive. On U.S. transactional sites, ChatGPT-referred visitors convert at 7% versus 5% from Google. They stay 15 minutes on site against 8 and view 12 pages versus 9, per Similarweb’s 2025 Gen AI Landscape report.
Traffic Channel | Conversion Rate |
|---|---|
ChatGPT referrals | 11.4% |
Direct traffic | 10.2% |
Paid search | 9.3% |
Organic search | 5.3% |
Email | 4.6% |
Display | 4.0% |
Social media | 3.8% |
The advantage is strongest where purchases involve research rather than impulse. First Page Sage’s 2026 study found ChatGPT-referred traffic converting above every other channel in every industry it analyzed: Hotels & Resorts at 7.2% against a 3.6% overall rate, Higher Education at 5.4% versus 2.8%, and Legal Services at 4.9% versus 3.8%.
Independent measurements agree on the asymmetry. Ahrefs’ 2025 analysis found AI search visitors generating 12.1% of all signups while accounting for just 0.5% of total traffic, a 23x edge over traditional organic search. Conductor’s 2026 AEO/GEO benchmarks found ChatGPT driving 87.4% of all AI referral traffic, which averages roughly 1.08% of website traffic across industries.
Volume is only half the story. The May 7, 2026 product update replaced footnote citations with clickable brand names. Similarweb’s weekly referral data captured the jump: total ChatGPT referrals rose 157.7% week over week, and homepage referrals rose 354.7%. Homepage share settled at roughly 60-63% of all referral traffic through late May and held there rather than reverting. What AI systems cite and what users actually enter from are now visibly different surfaces: 58.8% of referred traffic lands on homepages while 65% of cited URLs sit two or three folders deep.
ChatGPT still dominates referral distribution, but the margin is compressing. Its referrals to third-party websites grew 52% year over year from September to November 2025. Over the same window, Gemini’s grew 388%, per Similarweb data shared with Digiday. Twelve months of that asymmetry reshaped the platform mix, per Similarweb data published June 11, 2026:
- ChatGPT: 52.7% of worldwide generative AI website traffic in May 2026, down from 76.4% a year earlier
- Gemini: 27.3%, up from 8.9%
- Claude: 8.9%, up from 1.6% after tripling over the year
Ads now sit inside that referral surface. Similarweb measured sponsored responses in 26% of U.S. desktop chats in June 2026, up from 14% in May, at a 0.50% click-through rate. About two-thirds of those ads (66.3%) appear after the second prompt or later, so paid placements trail the citations that send visitors to third-party sites rather than replacing them.
GPT-5 Benchmark Performance and Enterprise Adoption Statistics
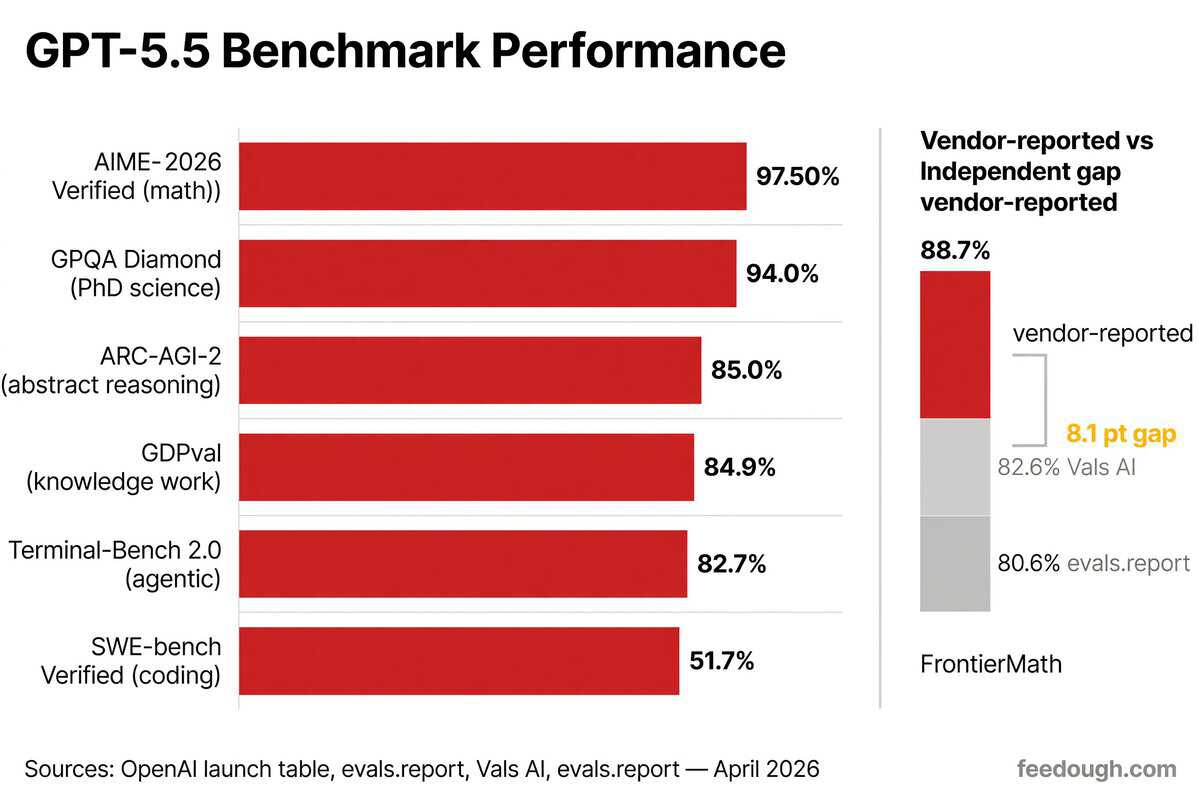
OpenAI’s April 23, 2026 launch table credits GPT-5.5 with 88.7% on SWE-bench Verified, the standard test of real-world coding ability. Independent measurements land lower. evals.report’s official April 23 evaluation put the model at 80.6%. Vals AI measured 82.6%, enough to rank first on its leaderboard. CodeLint’s 2026 leaderboard lists 88.7% as vendor-reported only. The rest of the GPT-5 performance statistics from the April 23 release hold up better under independent review:
Benchmark | GPT-5.5 Score | Context |
|---|---|---|
SWE-bench Verified (coding) | 88.7% | Vendor-reported; evals.report scored 80.6%, Vals AI measured 82.6% |
AIME 2026 (math) | 97.50% | Follows GPT-5.2’s perfect result on the 2025 paper |
GPQA Diamond (PhD-level science) | 94.0% | Slightly above OpenAI’s own 93.6% claim |
ARC-AGI-2 (abstract reasoning) | 85.0% | 11.7 points above GPT-5.4; ahead of Gemini 3.1 Pro (77.1%) |
Terminal-Bench 2.0 (agentic coding) | 82.7% | About 13 points ahead of Claude Opus 4.7 (69.4%) |
FrontierMath | 51.7% | The toughest open math benchmark in the release |
GDPval (knowledge work) | 84.9% | Win-or-tie rate against industry professionals across 44 occupations |
GPQA Diamond is the one benchmark where independent evaluators score GPT-5.5 above OpenAI’s claim: 94.0% against the 93.6% in the launch materials. Terminal-Bench 2.0 shows the widest gap over rivals, at 82.7% versus Claude Opus 4.7’s 69.4% and Gemini 3.1 Pro’s 68.5%. Math is effectively settled at this tier. GPT-5.5 hit 100% on the OTIS Mock AIME and 97.50% on AIME 2026, following GPT-5.2’s perfect result on the 2025 paper.
Scores only matter where they change outputs, and the accuracy data splits by model tier. With web browsing enabled, GPT-5.2 Thinking hallucinated on 0.8% of claims and 5.8% of responses, per OpenAI’s December 2025 system card. On business and marketing research prompts, its 0.7% claim-level rate beat GPT-5.1 Thinking’s 1.1%. Vectara’s May 2026 HHEM leaderboard tests grounded summarization across 105 models and spreads the GPT-5 family much wider. GPT-5-high hallucinated on 15.1% of summaries, while GPT-5.4-nano reached 3.1%, third-lowest on the board. Tier and grounding now matter more than generation number. Knowledge work shows the same direction without the variance. GPT-5.5 wins or ties 84.9% of GDPval matchups against industry professionals, per OpenAI’s April 23 launch table. That is up from GPT-5.4’s 83.0% and Claude Opus 4.7’s 80.3% across the 44 occupations measured.
Adoption moved with the scores. Within a week of the original GPT-5’s August 2025 launch, reasoning workloads on OpenAI’s platform increased eightfold. By January 2026, only 0.1% of daily ChatGPT users still selected GPT-4o. OpenAI retired it and five other legacy models on February 13, 2026. The commercial base kept pace. More than 9 million business users now pay for OpenAI products, and 92% of Fortune 500 companies run them in production, per Thunderbit’s OpenAI data compilation. Internal usage runs ahead of both. More than 85% of OpenAI employees used Codex weekly across several functions at GPT-5.5’s launch, per OpenAI’s April 23, 2026 report.
OpenAI API Usage and Token Consumption Statistics
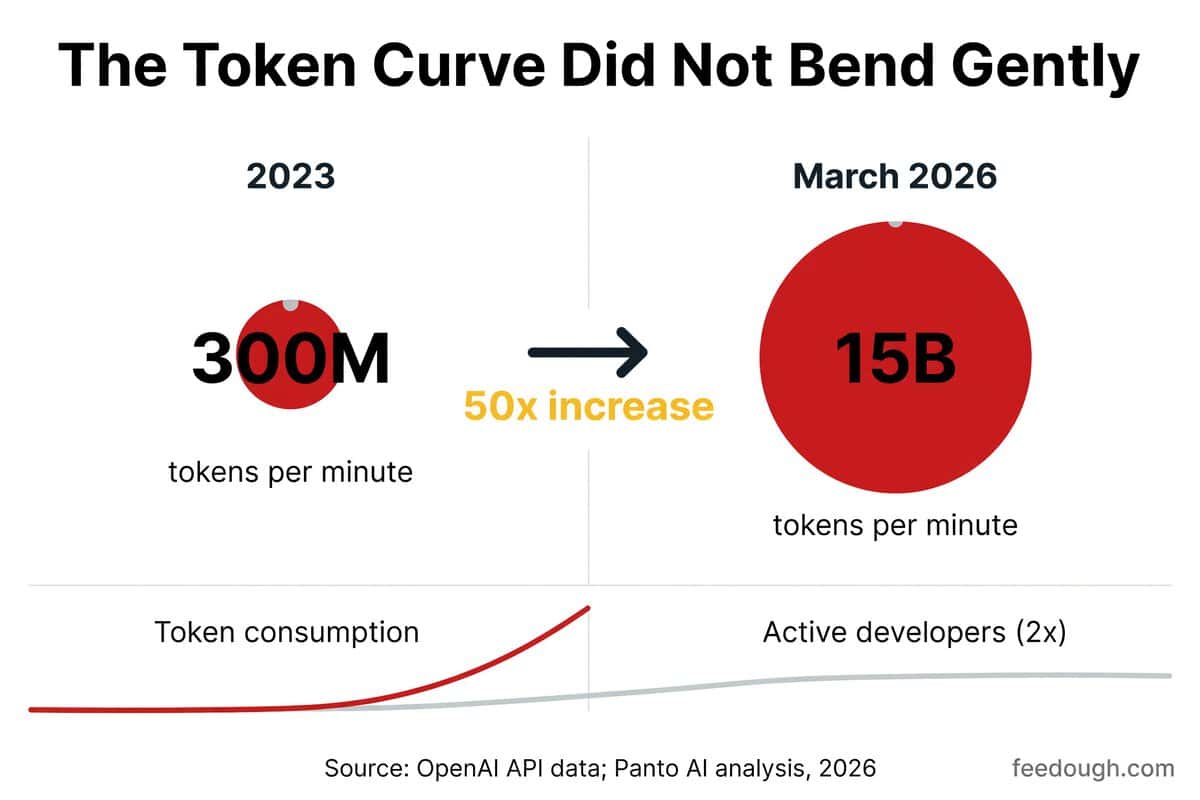
OpenAI’s API processed 300 million tokens per minute in 2023. By March 2026 that figure reached 15 billion tokens per minute, a 50x increase driven less by user count than by what each user asks the platform to do. Daily API calls rose from 1.3 billion in 2024 to more than 2.2 billion in 2025, while weekly active developers doubled to 4 million over roughly the same window. The user curve bent gently. The token curve did not.
Metric | Earlier Baseline | Latest Figure | Change |
|---|---|---|---|
Tokens processed per minute | 300 million (2023) | 15 billion (March 2026) | 50x increase |
Daily API calls | 1.3 billion (2024) | 2.2 billion+ (2025) | 69% year over year |
Weekly active developers | 2 million (2023) | 4 million (October 2025) | 2x growth |
Codex weekly active users | 2 million (March 2026) | 8 million (July 2026) | 4x in four months |
The type of workload explains the gap. Agentic models burn 5 to 30 times more tokens on a single task than a standard chatbot query, per Gartner’s March 2026 analysis. Codex, OpenAI’s agentic coding agent, crossed 7 million weekly active users on July 13, 2026 and climbed to 8 million within days as GPT-5.6 launched and Codex merged into the ChatGPT desktop app. Combined weekly actives across Codex and the new ChatGPT Work agent reached roughly 10 million by July 21, per OpenAI data compiled by Panto AI. Codex already accounts for more than 90% of the average engineer’s usage on the platform.
The same pattern holds at the enterprise level. Reasoning token consumption per business organization rose 320x year over year, per OpenAI’s State of Enterprise AI 2025 report. Inside OpenAI, median combined output tokens among active Codex users grew 56x in Research, 32x in Customer Support, 27x in Engineering, and 13x in Legal between November 2025 and June 2026, per the company’s How agents are transforming work report. Legal was the slowest function in that group and still multiplied its output more than tenfold.
The fastest-growing Codex users are not the ones OpenAI built the tool for:
- Non-developer adoption grew 137x among individual users and 189x among organizational users between August 2025 and early June 2026, with internal usage at OpenAI up 12x, per OpenAI
- Knowledge workers make up roughly 20% of Codex users and are adopting the platform 3x faster than developers, per Panto AI’s analysis of OpenAI data
- Codex CLI, OpenAI’s open-source terminal agent, passed 99,624 GitHub stars, and its npm downloads grew from 82,000 in April 2025 to 41.8 million in May 2026
Goldman Sachs projects a 24-fold increase in global AI token consumption by 2030, reaching 120 quadrillion tokens per month. OpenAI API usage statistics suggest the throughput must multiply several times over to hold its current share of that volume.
OpenAI Enterprise Adoption Statistics 2026
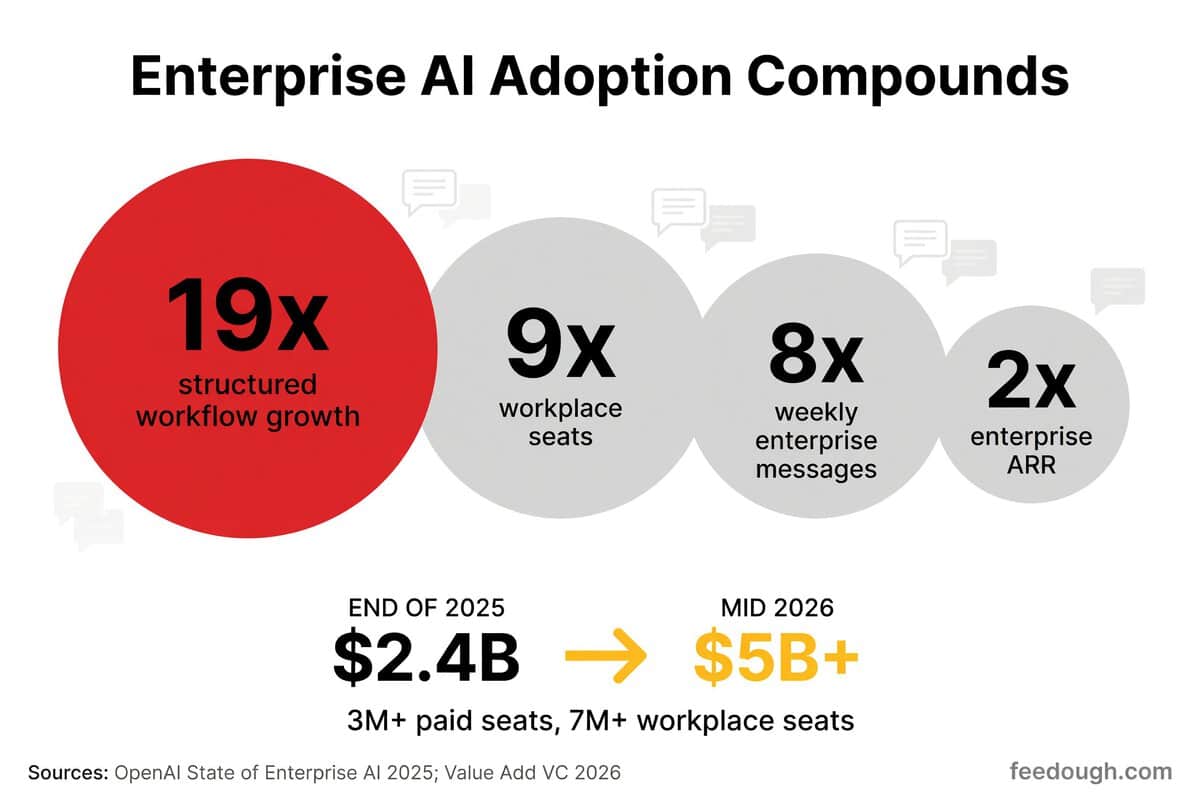
OpenAI’s enterprise business crossed $5 billion in annualized recurring revenue by mid-2026, more than double the $2.4 billion it booked at the end of 2025. OpenAI enterprise adoption now spans over 3 million paid seats and 7 million workplace seats, with enterprise seat volume growing roughly ninefold year over year. Only 20% of organizations have seen their AI initiatives grow revenue so far, per Deloitte’s State of AI in the Enterprise 2026 report. Another 74% expect them to.
Enterprise Metric | Figure | Context |
|---|---|---|
Paid Enterprise + Business seats | 3 million+ | Per-seat pricing of $40-80 monthly |
Total workplace seats | 7 million+ | About 9x year-over-year growth |
Enterprise ARR | $5 billion+ | Roughly 25% of total ARR; $2.4B at end of 2025 |
Weekly enterprise messages | 8x | Since November 2024; 30% more per worker year over year |
Structured workflow growth | 19x | Year to date; about 20% of messages via tailored assistants |
The expansion reaches well beyond U.S. enterprises. Every major non-U.S. market outpaced the 143% global average for enterprise message growth between November 2024 and November 2025, per OpenAI’s State of Enterprise AI 2025 report. Australia led at 187%, with Brazil at 161%, the Netherlands at 153%, and France at 146%. More than a quarter of U.S. workers now use ChatGPT for work, per OpenAI’s January 2026 report, including 45% of those with postgraduate degrees.
OpenAI Stargate Data Center Capacity Statistics
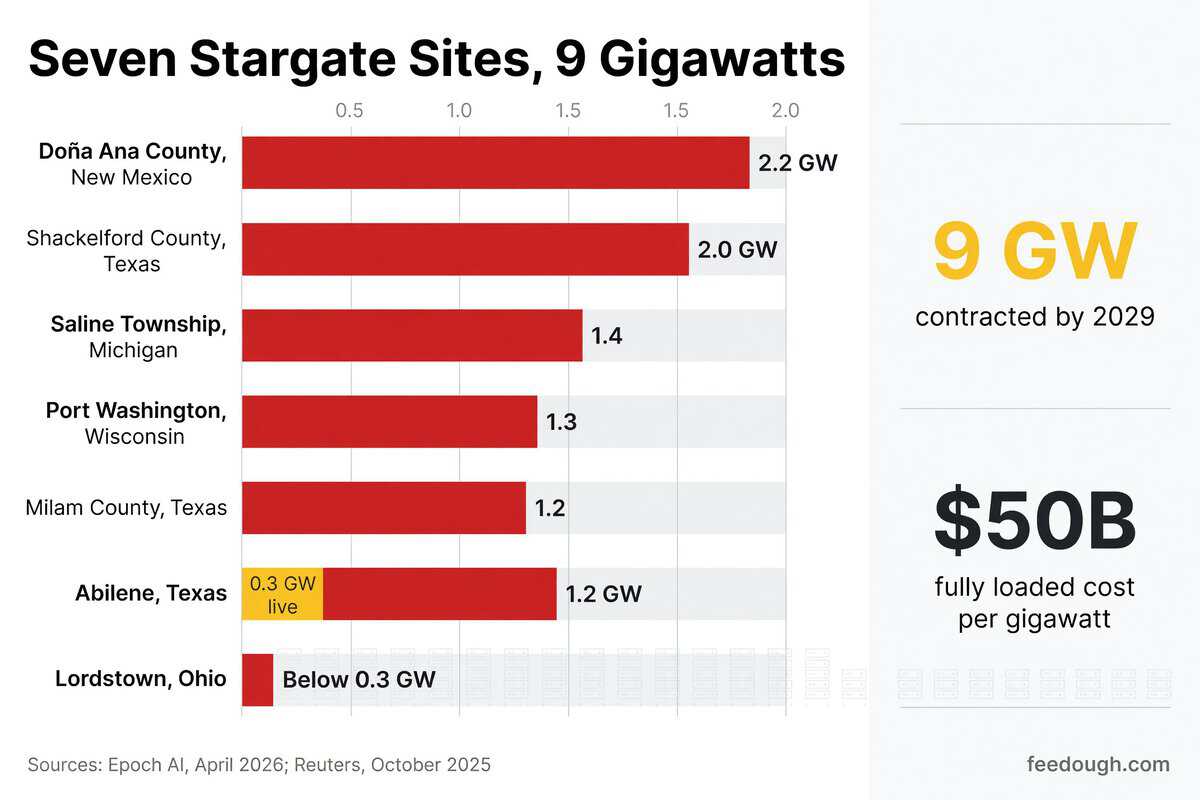
OpenAI ran 0.2 GW of data center capacity in 2023 and 1.9 GW by the end of 2025. Every gigawatt it adds from here costs roughly $50 billion fully loaded, per Reuters reporting on the October 2025 Michigan Stargate announcement. The seven Stargate sites now in development push contracted capacity past 9 GW by 2029, per Epoch AI’s April 2026 satellite analysis. Only 0.3 GW of that is live today.
Site | State | Planned Capacity | Status and Context |
|---|---|---|---|
Doña Ana County | New Mexico | 2.2 GW | Second-largest site in the portfolio |
Shackelford County | Texas | 2.0 GW | 1,200-acre campus with 10 buildings; completion projected for Q4 2028 |
Saline Township | Michigan | 1.4 GW | Great Lakes region anchor; construction slated for early 2026 |
Port Washington | Wisconsin | 1.3 GW | Midwest presence |
Abilene | Texas | 1.2 GW | 0.3 GW operational; four of eight buildings running Nvidia Blackwell chips; completion projected for Q4 2026 |
Milam County | Texas | 1.2 GW | $1 billion joint investment with SoftBank in SB Energy |
Lordstown | Ohio | Below 0.3 GW | Smallest site in the network |
Capacity is being redirected nearly as fast as it is being built. OpenAI had planned to stretch Abilene to 2.1 GW, then reversed course and pointed that capacity at other locations. Microsoft moved into the adjacent 900 MW plot with Crusoe as a partner, per Epoch AI’s satellite analysis. Once Abilene reaches full load, its 1.2 GW works out to roughly 1.0 million H100-equivalents of compute.
The capital and hardware commitments behind the rest of the buildout span three continents and several chip architectures:
- $300 billion partnership with Oracle to develop up to 4.5 GW across Texas, New Mexico, and Midwest sites over five years
- 10 GW of Nvidia systems under a September 2025 strategic partnership, with Nvidia committing up to $100 billion as Vera Rubin systems deploy, first phase targeted for H2 2026
- 6 GW of AMD MI300-series accelerators, splitting the hardware pipeline across suppliers rather than relying on one
- $1 billion joint investment with SoftBank in SB Energy, backing the 1.2 GW Milam County, Texas campus
- $25 billion Stargate Argentina project in Patagonia, the first Stargate site in Latin America and the largest AI data center in the region
Custom silicon is where the unit-cost argument gets decided. OpenAI and Broadcom unveiled Jalapeño on June 24, 2026, a TSMC 3-nanometer inference chip with eight HBM memory stacks integrated on-package. The pair went from blank slate to tape-out in nine months, using OpenAI’s own models to accelerate the design. OpenAI targets roughly 50% lower cost per token on Jalapeño than on comparable Nvidia GPU clusters, with prototypes deploying by the end of 2026 and production scaling through 2027 and 2028. Inference already costs cents per million tokens, down from under $1 earlier in 2026, per CFO Sarah Friar’s January 2026 blog post.
The August 25, 2026 benchmark results against Nvidia’s GB200 and GB300 came from vendor-run engineering samples rather than independently reproduced production runs. Broadcom CEO Hock Tan told CNBC the chip still runs a small prototype phase in late 2026 before scaling. Altman’s own target sits further out: 30 GW of capacity and $1.4 trillion in total build-out, at a deployment rate of one gigawatt per week.
ChatGPT Website Traffic and Engagement Statistics 2026
ChatGPT held fifth place among all websites globally in September 2026, unchanged from August, trailing only Google, YouTube, Facebook and Instagram, per Similarweb. It was also the only site in Similarweb’s global top 10 to grow more than 1% month over month, the second straight month it managed that. WhatsApp and TikTok each climbed a spot that month. Bing dropped two.
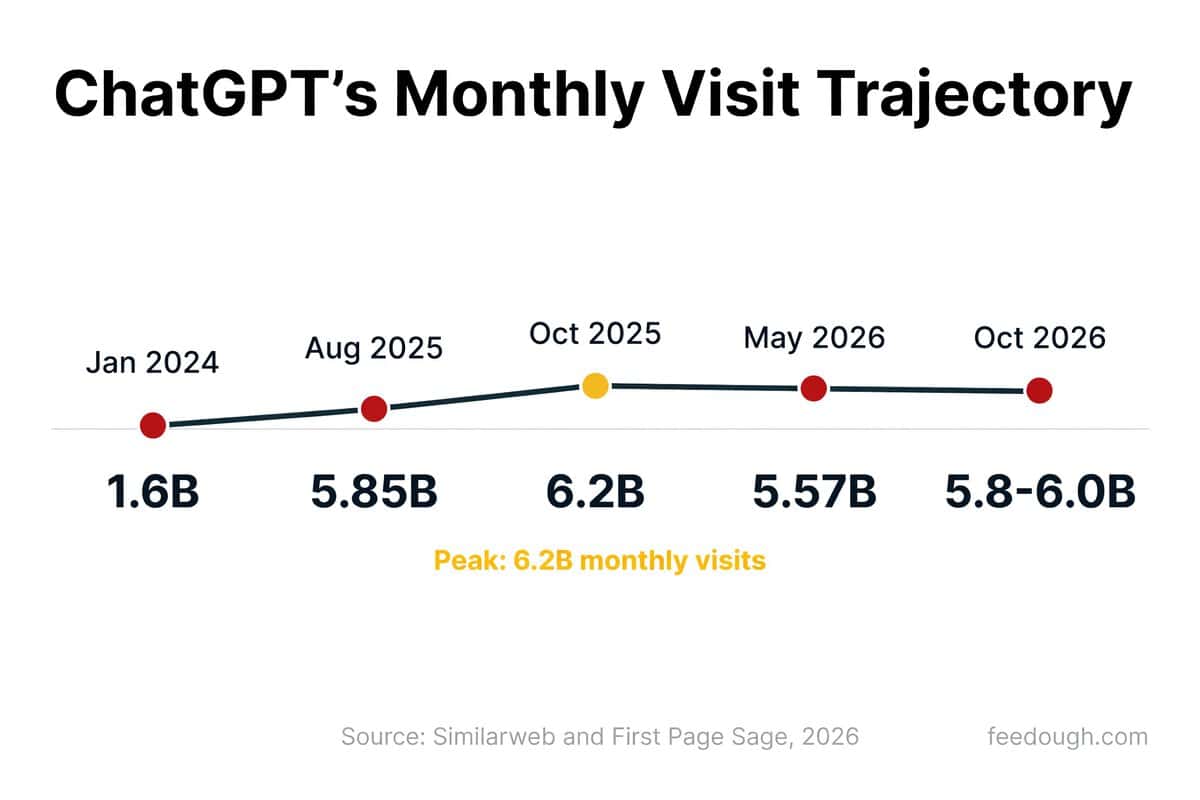
ChatGPT website traffic has changed character since January 2024, when 1.6 billion monthly visits counted as the platform’s first major public milestone. Visits multiplied roughly fourfold in under two years, peaking at 6.2 billion in October 2025. As of October 2026, chatgpt.com draws roughly 5.8 to 6.0 billion monthly visits, per First Page Sage, close to that record without clearing it. The trajectory looks like this:
Period | Monthly Visits | Context |
|---|---|---|
January 2024 | 1.6 billion | First major monthly visit milestone publicly reported |
July 2024 | 2.4 billion | Passed the January 2024 mark; per Similarweb |
August 2025 | 5.846 billion | 489 million unique visitors |
October 2025 | 6.2 billion | Highest monthly total recorded through early 2026 |
May 2026 | 5.565 billion | Ranked #5 globally; 24.02% year-over-year growth |
October 2026 | 5.8 to 6.0 billion | Per First Page Sage; #5 rank unchanged since August |
The flat topline conceals what changed inside those sessions. Similarweb’s August 2026 data puts chatgpt.com’s bounce rate at 26.58%, down from 33.47% four months earlier. Visitors now open 4.66 pages per visit and stay an average of 6 minutes 40 seconds. A site shedding that share of one-page visitors is not a novelty wearing off. It is a routine taking hold.
In the United States, chatgpt.com ranked tenth in May 2026 with 981.8 million visits, up 76.14% year over year. No other AI platform came close in Similarweb’s U.S. top 100: Gemini sat at #22 and Claude.ai at #36. The global web audience skews desktop, with 73.11% of chatgpt.com traffic arriving from computers against 26.89% from phones. Top traffic countries ran the United States at 18.53%, India at 9.79% and Brazil at 5.57%, per Similarweb data compiled by DemandSage in September 2026.
That desktop tilt describes the browser, not the user base. Roughly 64% of generative AI users reach tools like ChatGPT exclusively through mobile devices, per Sensor Tower data cited by Thunderbit. Sensor Tower’s State of AI 2026 report projects 36 billion hours spent in generative AI apps in the first half of 2026, more than double the 17.2 billion hours of H1 2025. ChatGPT, DeepSeek and Google Gemini together took nearly 90% of AI assistant time in Q1 2026. Browser visits are the measurable slice of a much larger footprint.
Microsoft’s $13 billion of OpenAI investments produced a 17.6x paper multiple, with its 26.79% stake valued at roughly $228.3 billion as of March 2026. Then Microsoft rewrote the deal that produced that return. The April 27, 2026 restructuring removed exclusivity, ended the AGI-linked termination trigger, and capped the revenue share OpenAI owes through 2030. OpenAI gained the freedom to serve any cloud provider. Microsoft traded open-ended upside for a fixed commercial relationship running to the end of the decade.
The final ownership math arrived with OpenAI’s conversion of its for-profit subsidiary into a public benefit corporation. That structure hands Microsoft a 27% stake in the new entity, per The Wall Street Journal, while the nonprofit parent receives a stake worth $130 billion. The same transaction pushed Microsoft’s own market valuation above $4 trillion.
The terms on either side of the rewrite break down like this:
Partnership Term | Original Structure | After April 27, 2026 Restructuring |
|---|---|---|
Total Microsoft investment | $13 billion committed; $11.9 billion funded as of June 30, 2026 | Unchanged; $3.1 billion equity-method hit in fiscal Q1 2026 |
Microsoft stake | About 32.5% under the prior for-profit structure | 27% in the public benefit corporation; ~$228.3 billion at March 2026 valuation |
Cloud relationship | Exclusive Azure partnership for API products | Non-exclusive; OpenAI launches first on Azure unless Microsoft cannot support required capabilities |
Revenue share (OpenAI to Microsoft) | About 20% of revenues; ends when AGI verified | Capped at $38 billion total through 2030; AGI-linked termination removed |
Revenue share (Microsoft to OpenAI) | Microsoft paid OpenAI a share of Azure OpenAI Service and Bing revenues | Microsoft stopped paying OpenAI a revenue share on Azure resales |
IP license | Exclusive through 2032, excluding consumer hardware | Non-exclusive through 2032; other cloud providers may access OpenAI models |
Azure purchase commitment | Not separately disclosed | OpenAI committed to $250 billion of Azure services (confirmed October 2025) |
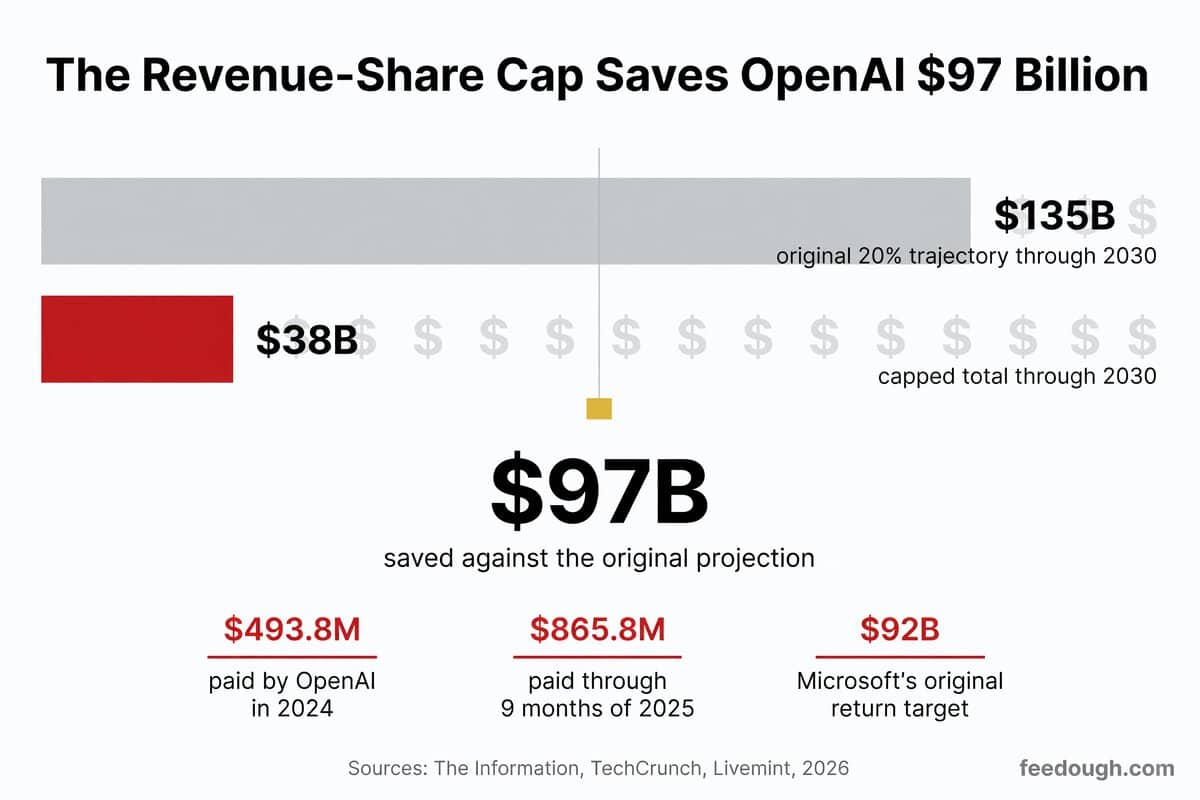
The revenue-share cap reshapes the economics more than any other line in that table. At the original 20% rate, the payment trajectory implied OpenAI would owe Microsoft roughly $135 billion before 2030. The new ceiling of $38 billion saves OpenAI an estimated $97 billion against that projection, a cap independently confirmed by The Information in May 2026. Microsoft had aimed higher from the start: planning documents from early 2023, disclosed in federal court during Elon Musk’s lawsuit against OpenAI, show Microsoft targeted a $92 billion return from its early investments, per Livemint’s reporting.
Payment volumes to date show how far below that target the cap lands. Leaked financial documents reviewed by TechCrunch in November 2025 show OpenAI paid Microsoft $493.8 million in 2024, a figure that nearly doubled to $865.8 million across the first three quarters of 2025. At the original rate, those payments implied OpenAI revenues of at least $2.5 billion in 2024 and $4.33 billion through nine months of 2025.
Microsoft books the relationship on its own balance sheet too. Its fiscal 2026 Form 10-K disclosed $24.1 billion in revenue from commercial arrangements with OpenAI, covering Azure purchases and revenue-sharing payments, alongside $6 billion in accounts receivable from OpenAI as of June 30, 2026. The $228.3 billion stake alone accounts for roughly 8.2% of Microsoft’s $2.78 trillion market capitalization. Microsoft OpenAI partnership statistics therefore describe both a capped income stream and a concentration exposure in a single private holding, with the renegotiated terms giving OpenAI a cleaner financial story to take into a possible IPO as soon as the end of 2026, per The Information.
OpenAI Employee and Workforce Statistics: Headcount, Pay, and Turnover
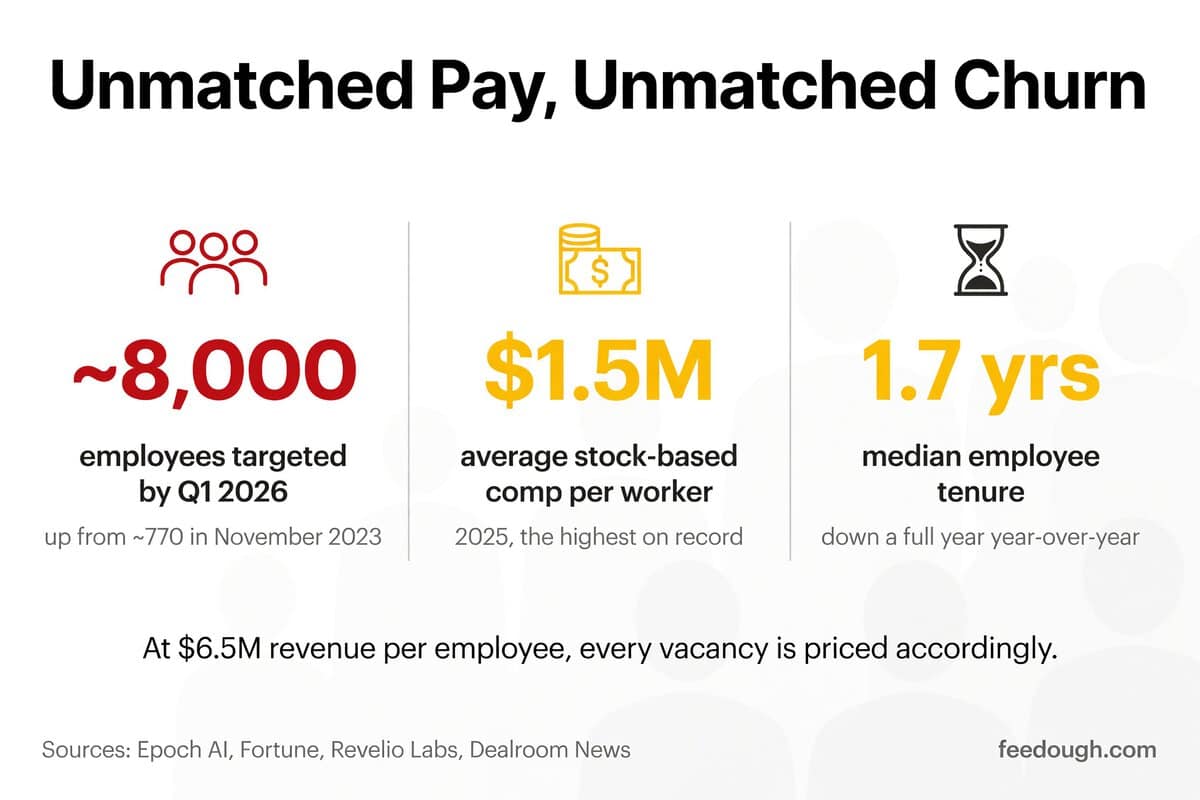
OpenAI generates roughly $6.5 million in revenue per employee, per Epoch AI’s May 2026 tracker. Only Anthropic, at about $14 million, does better, and no company on Forbes’ Global 2000 list reaches either figure. The headcount behind that output has multiplied nearly as fast, though the 2026 counts disagree with each other:
Date / Period | Headcount | Context |
|---|---|---|
November 2023 | ~770 | Pre-scaling baseline |
September 2024 | 3,531 | Nearly 5x increase in under a year |
End of 2024 | 4,467 | OpenAI Foundation year-end figure |
December 2025 | 7,850 | 54.9% year-over-year increase |
February 2026 | 4,433 | Epoch AI count against $25 billion annualized revenue, implying about $5.64 million per employee |
Q1 2026 target | ~8,000 | FT reported direct payroll nearer 4,500; the gap reflects methodology differences |
The February and Q1 2026 splits are a counting problem, not a headcount collapse. Choose the direct-payroll base and revenue per worker lands near $5.64 million; choose the company-reported base and it climbs past $6.5 million. Either way, the ratio is unmatched in corporate history.
The pay attached to those roles is equally without precedent. Average stock-based compensation reached $1.5 million per worker in 2025, the highest recorded for any major tech startup, per Fortune. Makerstations’ 2026 compilation puts median total compensation across all roles at $608,182, with software engineers at a $555,000 median. Comp distributions weighted toward technical roles run higher still: a $1,370,000 median, with the 90th percentile at $2,792,200. Research engineers earn $295,000 to $530,000 in base salary, software engineers $255,000 to $590,000.
Where that money lands inside the org chart is narrow. Engineering accounts for roughly 56% of staff, about 1,480 people in Unify’s breakdown, followed by Business Management (233), Marketing and Product (225), and Human Resources (212). Women and non-binary people make up roughly 44% of staff overall yet hold just 16% of technical roles, per OpenAI’s DEI report.
OpenAI’s employee and workforce statistics through March 2026 describe a company losing people nearly as fast as it hires them. Median employee tenure stood at 1.7 years, down a full year year-over-year, per Revelio Labs. The exits have clustered at the top:
- 12 senior executives departed in 2026 alone, spanning operations, commercial, product, research, safety, ethics and hardware, including COO Brad Lightcap, applications CEO Fidji Simo and chief revenue officer Denise Dresser, per Dealroom News
- Over 50 senior researchers and roughly a quarter of the company’s leadership left across two years, some founding competitors and others joining Meta’s recruiting pipeline
- Roughly 50% of safety researchers have turned over, with OpenAI’s only dedicated AI ethicist, Chloé Bakalar, leaving in July 2026 and the 6-to-7-person Mission Alignment team disbanded in February
- A retention-bonus program launched in August 2025 covering nearly 1,000 employees, with payouts ranging from $300,000 to $1.5 million
- Active job postings rose 87.5% in 2026 to 945, a pace that implies replacement and expansion running on the same timeline
The bonus pool and the hiring pipeline attack the same problem from opposite ends: hold the people worth holding, and staff fast enough that the departures never stall the buildout. At $6.5 million of revenue per employee, every vacancy is priced accordingly.
OpenAI Profit and Loss Statistics: Audited Losses and Cash Burn
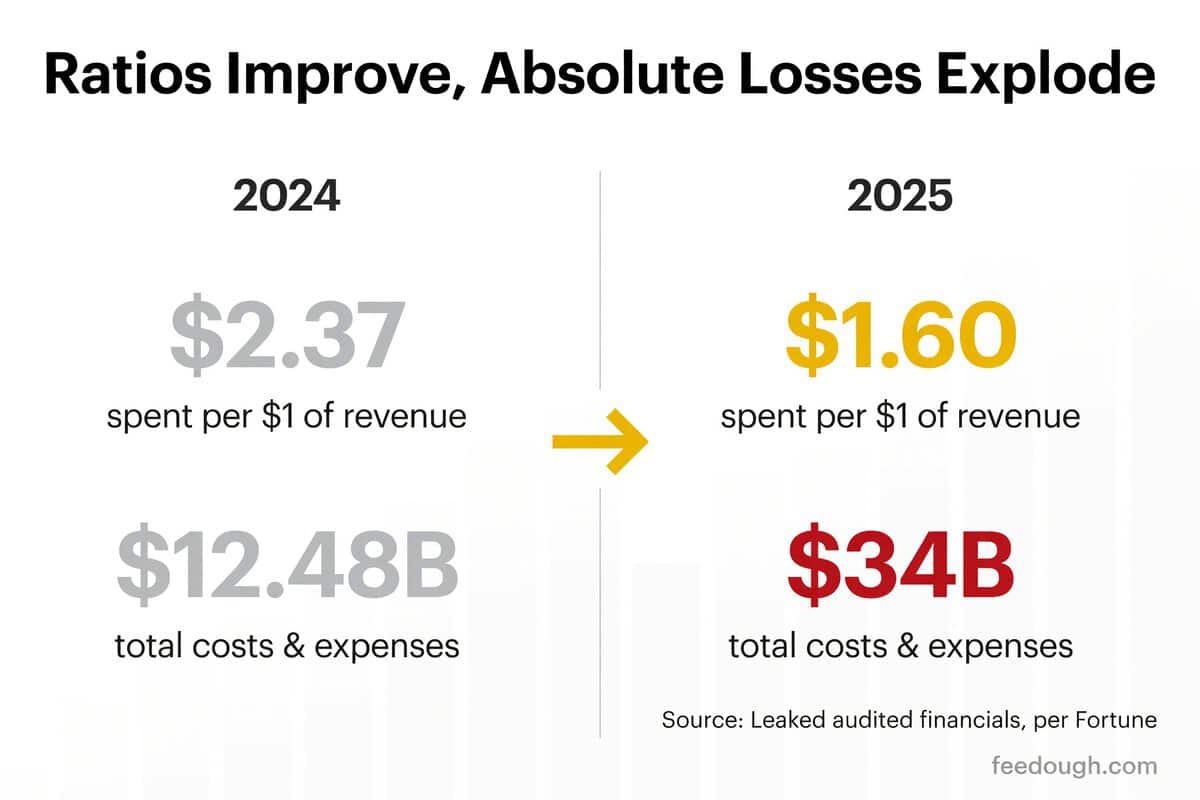
OpenAI’s profit and loss statistics improved on every ratio and worsened on every absolute number in 2025. It spent $2.37 for each dollar of revenue in 2024. In 2025 that fell to $1.60, per Fortune’s analysis of the leaked audited financial statements verified by the Financial Times. Operating losses dropped from 237% of revenue to 160% across those two years. Underneath that improvement, total costs and expenses nearly tripled, from $12.48 billion in 2024 to $34 billion in 2025. The 2024 audited statements put the loss from operations at $8.78 billion and the net loss attributable to the company at $5.09 billion.
Metric | Figure | Source |
|---|---|---|
Expenses per $1 of revenue, 2024 | $2.37 | Leaked audited financials, per Fortune |
Expenses per $1 of revenue, 2025 | $1.60 | Leaked audited financials, per Fortune |
Operating loss vs. revenue, 2024 | 237% | Audited statements; $8.78 billion loss on $3.7 billion of revenue |
Operating loss vs. revenue, 2025 | 160% | Audited statements verified by the Financial Times |
Cash burn vs. revenue, 2026 and 2027 | 57% | Company forecast, per Wall Street Journal documents |
Cumulative operating losses through 2030 | Nearly $500 billion | HSBC research forecast |
The ratio improvement has not changed OpenAI’s position relative to its closest rival. Both OpenAI and Anthropic burned roughly 70% of revenue in 2025, then split. Anthropic forecasts cutting its cash burn to about one-third of revenue in 2026 and 9% by 2027, per Wall Street Journal documents reported by Fortune. It projects an operating profit near $559 million for the second quarter of 2026. OpenAI’s burn rate holds flat across both years instead. Per financial documents reviewed by The Wall Street Journal, it will consume roughly 14 times more cash than Anthropic before reaching profitability.
OpenAI Future Revenue Projections and 2030 Growth Forecasts
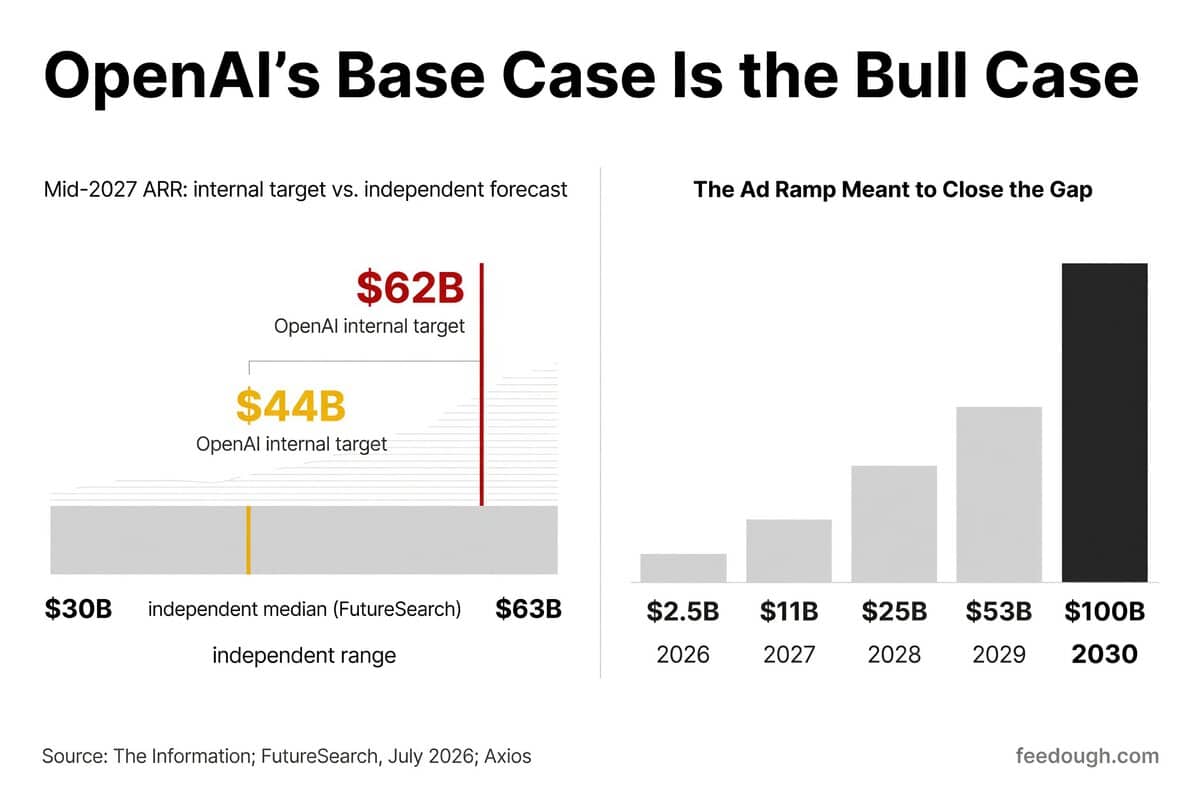
OpenAI’s internal plan calls for $62 billion in annualized recurring revenue by mid-2027. Independent forecasters put the same date at a $44 billion median, per FutureSearch’s July 2026 expert panel. The full outside range runs from $30 billion to $63 billion. Even the bull case only reaches what OpenAI treats as its base case.
OpenAI revenue projections have moved faster than the business beneath them. A February 2026 revision lifted the five-year target by 27% in a single month, to roughly $280 billion of cumulative revenue through 2030.
Year / Period | OpenAI Internal Target | Independent Forecast | Source |
|---|---|---|---|
2026 (annual) | $30 billion | Not separately forecast | Bloomberg, February 2026 |
Mid-2027 (ARR) | $62 billion | $44 billion median (range: $30 billion to $63 billion) | The Information; FutureSearch, July 2026 |
2029 (annual) | ~$125 billion | Not separately forecast | CNBC, September 2025 |
2030 (cumulative) | ~$280 billion | Break-even not projected before 2031 | Bloomberg; BNP Paribas, HSBC, FutureSearch |
The $280 billion arrives through four lines of business, and the mix matters more than the total:
- Consumer subscriptions: $150 billion, more than half the five-year total
- Enterprise: $70 billion, the second pillar of the plan
- API: $47.5 billion
- Hardware: $100 million in 2026, a line that has to scale from near zero
Behind the revenue sits a cost base growing just as fast. OpenAI now projects cumulative spending of $665 billion through 2030, with training alone accounting for $440 billion, per The Information and CNBC. Internal plans put annual cash burn at $57 billion in 2027. Sacra’s independent estimate runs higher, at roughly $27 billion in 2026 and $63 billion in 2027 under the renegotiated Microsoft deal. On that path OpenAI loses about $1.22 for every dollar it earns. HSBC estimates the company needs at least $207 billion in new funding to reach 2030.
Advertising is the line meant to close that gap. The ramp OpenAI gave investors runs from $2.5 billion in 2026 to $11 billion in 2027, reaching $100 billion by 2030, per Axios. The intermediate years land at $25 billion in 2028 and $53 billion in 2029. The ad pilot behind those numbers produced $100 million in recurring revenue in under two months. Neither the internal plan nor the outside forecasts answer whether a new ad channel can scale that fast against a spend this large.
Sources
- https://valueaddvc.com/blog/openai-revenue-2026-20b-arr-4b-month-path-to-profitability (2026)
- https://aibusinessweekly.net/p/openai-statistics (2026)
- https://www.bloomberg.com/news/articles/2026-10-09/openai-expects-70-billion-in-annualized-revenue-by-end-of-2026 (2026-10-09)
- https://explodingtopics.com/blog/openai-revenue (2026)
- https://valueaddvc.com/blog/openai-valuation-2026-852-billion-after-the-122b-raise (2026-09-16)
- https://apptopia.com/en/insights/gen-ai-chatbots-april-2026-apptopia-data-brief-chatgpt-drops-below-40-market-share (2026)
- https://presenc.ai/research/chatgpt-usage-statistics (2026)
- https://mvidmar.substack.com/p/openai-14-billion-losses-2026-anthropic-enterprise (2026)
- https://www.getpanto.ai/blog/openai-statistics (2026)
- https://pinggy.io/blog/openai_anthropic_funding_history (2026)
- https://www.tomshardware.com/tech-industry/amazon-invests-50-billion-in-openai (2026)
- https://tech-insider.org/openai-122-billion-funding-round-852-billion-valuation-2026 (2026)
- https://www.klover.ai/openai_ipo_institutional_vs_retail_indepth_analysis_2026 (2026)
- https://www.zacks.com/featured-articles/781/openai-ipo (2026)
- https://tech-insider.org/ca/chatgpt-1-billion-users-2026 (2026)
- https://www.demandsage.com/chatgpt-statistics (2026-09-22)
- https://www.growthcentr.com/chatgpt-statistics-2026 (2026)
- https://thedigitalelevator.com/blog/chatgpt-statistics (2026)
- https://seoprofy.com/blog/chatgpt-statistics (2026-06)
- https://www.gradually.ai/en/chatgpt-statistics
- https://searchlab.nl/en/statistics/chatgpt-statistics-2026 (2026-03-17)
- https://www.digitalinformationworld.com/2026/06/chatgpt-loses-share-of-app-downloads-as.html (2026-06)
- https://www.semrush.com/website/openai.com/overview (2026-09-17)
- https://aisearch.similarweb.com/blog/claude-vs-chatgpt
- https://www.pewresearch.org/internet/2026/06/17/how-opinions-and-use-of-ai-differ-by-age (2026-06-17)
- https://www.usecarly.com/blog/how-many-people-use-ai (2026)
- https://www.omnibound.ai/blog/chatgpt-user-statistics (2025-12)
- https://apidog.com/blog/gpt-5-5-pricing (2026-06-17)
- https://www.morphllm.com/openai-api-pricing (2026-08-21)
- https://www.g2.com/articles/openai-api-pricing (2026)
- https://www.wheresyoured.at/oai_docs
- https://www.companieshistory.com/azure-openai-statistics (2026)
- https://www.cognizo.ai/blog/chatgpt-ai-visibility-statistic (2026)
- https://x.com/aleyda/status/2080262814732615856 (2026)
- https://ppc.land/similarweb-opens-ai-ad-data-as-26-of-chatgpt-replies-carry-sponsored-ads (2026-07-22)
- https://firstpagesage.com/seo-blog/chatgpt-conversion-rates (2026)
- https://www.getpassionfruit.com/blog/ai-search-statistics-the-numbers-marketers-need-updated-monthly (2026)
- https://ppc.land/chatgpt-drops-to-52-7-as-claude-triples-its-ai-traffic-share (2026-06-11)
- https://evals.report/models/openai-gpt-5-5 (2026-04-23)
- https://tosea.ai/blog/gpt-5-5-complete-guide (2026-04-23)
- https://www.digitalapplied.com/blog/gpt-5-5-vs-claude-opus-4-7-frontier-comparison (2026-04-23)
- https://kingy.ai/news/gpt-5-5-benchmarks-revealed-the-9-numbers-that-prove-chatgpt-5-5-just-changed-the-ai-race (2026-04-23)
- https://www.elitecontentmarketer.com/ai-hallucination-statistics (2026-05-11)
- https://thunderbit.com/blog/chatgpt-stats-usage-growth-trends (2026)
- https://www.unite.ai/openai-closes-on-anthropic-in-ramps-business-spending-data (2026-08-20)
- https://firstpagesage.com/reports/top-generative-ai-chatbots (2026-09)
- https://qz.com/openai-anthropic-business-ai-spending-ramp-data-082126 (2026-08-21)
- https://apptopia.com/en/insights/gen-ai-chatbots-june-2026 (2026-06)
- https://fatjoe.com/blog/grok-ai-stats (2026-10)
- https://www.companieshistory.com/chatbot-market-size (2026-08)
- https://presenc.ai/research/enterprise-llm-adoption-statistics-june-2026 (2026-06)
- https://valueaddvc.com/blog/openai-vs-anthropic-which-ai-company-is-winning-the-enterprise-in-2026 (2026)
- https://commandlinux.com/statistics/chatgpt-vs-gemini-vs-claude-usage-market-share (2026)
- https://www.getpanto.ai/blog/codex-ai-statistics (2026)
- https://openai.com/index/how-agents-are-transforming-work
- https://xtendedview.com/openai-statistics (2026)
- https://valueaddvc.com/blog/openai-enterprise-revenue-2026-what-we-know-about-contracts-seats-and-arr (2026)
- https://www.deloitte.com/us/en/what-we-do/capabilities/applied-artificial-intelligence/content/state-of-ai-in-the-enterprise.html (2026)
- https://epoch.ai/publications/openai-stargate-where-the-us-sites-stand (2026-04-17)
- https://www.reuters.com/technology/openai-oracle-related-digital-announce-new-stargate-data-center-michigan-2025-10-30 (2025-10-30)
- https://www.techpillow.co/blog/openai-jalapeno-broadcom-custom-ai-inference-chip-2026 (2026-06-24)
- https://kingy.ai/news/openai-jalapeno-inference-chip (2026-08-25)
- https://x.com/Similarweb/status/2109974139792752877 (2026-10-13)
- https://firstpagesage.com/seo-blog/chatgpt-usage-statistics (2026-10)
- https://www.similarweb.com/top-websites
- https://www.facebook.com/Similarweb/posts/top-10-websites-by-total-visits-in-september-2026-whatsapp-and-tiktok-both-moved/1567804068720204 (2026-10)
- https://www.similarweb.com/blog/research/market-research/most-visited-websites-usa
- https://sensortower.com/blog/state-of-ai-2026 (2026)
- https://www.wsj.com/tech/ai/openai-converts-to-public-benefit-corporation-with-microsoft-taking-27-stake-714a6c05
- https://www.livemint.com/companies/news/openai-and-microsoft-cap-revenue-sharing-at-38-billion-as-openai-eyes-ipo-11778568265547.html (2026-05-12)
- https://www.businesstoday.in/technology/story/openai-microsoft-cap-ai-revenue-sharing-payouts-at-38-billion-530973-2026-05-12 (2026-05-12)
- https://epoch.ai/data-insights/revenue-per-employee-ai-companies (2026-05-08)
- https://www.makerstations.io/openai-employee-statistics (2026)
- https://dealroom.co/news/145108-openais-revolving-door-spins-on-12-executives-exit-in-2026 (2026)
- https://explainx.ai/blog/openai-leadership-safety-exodus-lightcap-august-2026 (2026-08-12)
- https://fortune.com/2026/06/16/openai-financials-leaked-losses-revenue-profit (2026-06-16)
- https://arstechnica.com/ai/2026/06/leaked-financial-docs-show-openai-is-losing-billions-of-dollars-a-year (2026-06-17)
- https://www.wheresyoured.at/exclusive-openai-financials (2026-06-16)
- https://finance.yahoo.com/markets/stocks/articles/openai-2025-financials-leaked-38-121508294.html (2026-06-16)
- https://fortune.com/2025/11/12/openai-cash-burn-rate-annual-losses-2028-profitable-2030-financial-documents (2025-11-12)
- https://www.facebook.com/dzrhnews/posts/openai-forecasts-cash-burn-near-280-billion-by-2030-ft-reports/1744402477726869 (2026)
- https://www.axios.com/2026/04/09/openai-100-billion-in-ad-revenue (2026-04-09)
- https://mlq.ai/news/openai-revises-projections-upward-with-112-billion-extra-cash-burn-by-2030 (2026)
- https://tech-insider.org/openai-ipo-850-billion-valuation-2026 (2026)