
Most companies are still debating whether AI chatbots actually improve customer service. The ones that already deployed them are watching their market value surge past $11 billion.
AI chatbot statistics from 2026 show the global market reached $11.8 billion this year, a 23.2% jump from $9.56 billion in 2025. The trajectory points toward $27.29 billion by 2030.
Here is what the data reveals about which industries are moving fastest, how these tools actually perform, and where the ROI is real.
Key AI Chatbot Statistics
AI chatbot usage crossed a new threshold in 2025: 24% of US adults now use chatbots daily, and 44% of companies are actively deploying chatbot agents.
- 88% of people have had at least one conversation with a chatbot in the past year
- 12% of US employees use AI daily and 26% use it at least a few times a week, while nearly half never use it in their role
- 67% increase in sales reported by business leaders using chatbots
- 1% of users rated their chatbot interaction as negative
- The global chatbot market is valued at approximately USD 15.6 billion in 2024, projected to reach USD 46.6 billion by 2029 at a 24.5% CAGR
- 26% of workers with master’s degrees use chatbots daily
- 44% of companies were deploying or actively assessing AI agents in 2025, up sharply from the sub-35% range recorded a year earlier
- 60% of B2B companies and 42% of B2C companies use chatbot software for customer interactions
- 84% of enterprises with 5,000+ employees use chatbots, compared to 31% of micro-businesses under 50 employees
- 24% of US adults use AI chatbots daily, including 12% several times a day and 4% almost constantly
- The global chatbot market is expected to grow from USD 9.30 billion in 2025 to USD 32.45 billion by 2031 at a 23.15% CAGR
AI Chatbot Market Size and Growth Statistics
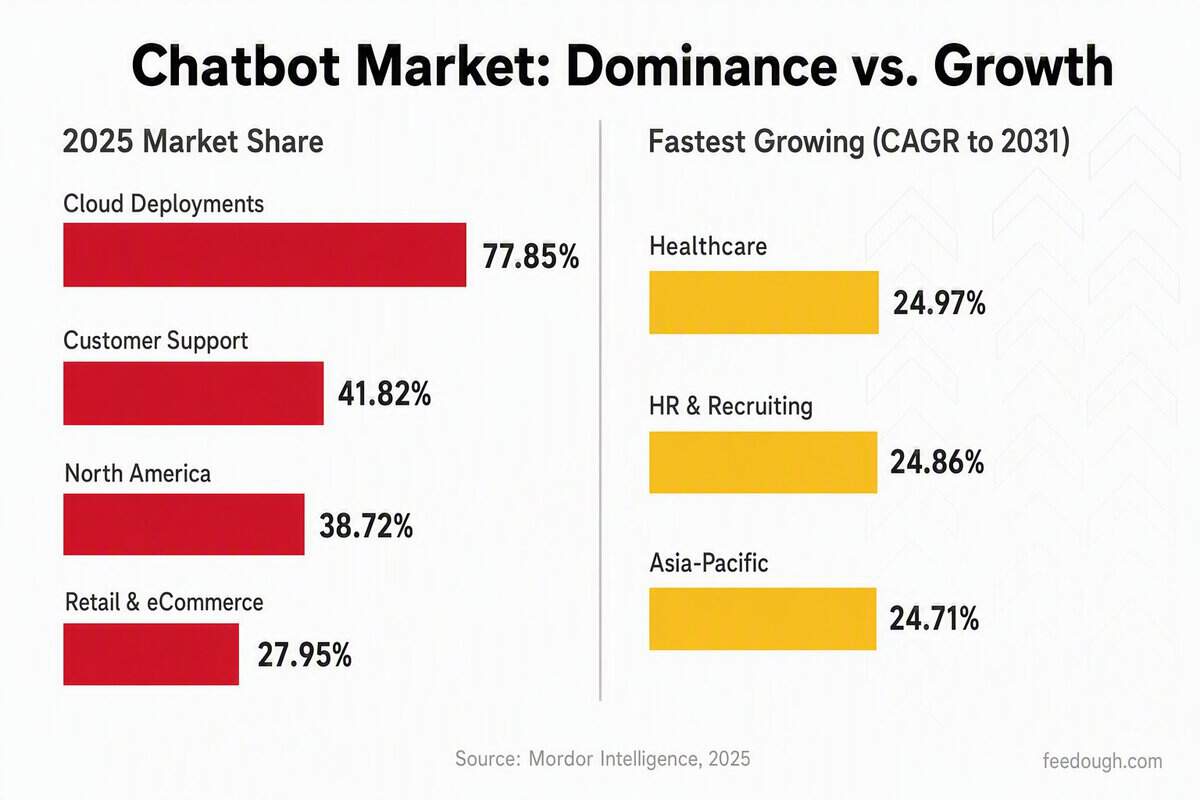
North America held 38.72% of global chatbot revenue in 2025, more than any other region. But Asia-Pacific is expanding at a 24.71% CAGR through 2031, the fastest regional growth rate worldwide. The chatbot market size is not distributed evenly, and the gaps between segments reveal where momentum is building.
Metric | Value | Year |
|---|---|---|
North America market share | 38.72% | 2025 |
Customer support application share | 41.82% | 2025 |
Cloud deployment share | 77.85% | 2025 |
Retail & eCommerce revenue share | 27.95% | 2025 |
The dominant segments are concentrated in customer service and cloud infrastructure. But the fastest growth is appearing in areas that were afterthoughts two years ago:
- Asia-Pacific is the fastest-growing region at 24.71% CAGR through 2031, driven by mobile commerce adoption and government AI programs
- HR and recruiting is the fastest-growing application segment at 24.86% CAGR through 2031 as bots automate screening, scheduling, and policy inquiries
- Healthcare is the fastest-growing end-user industry at 24.97% CAGR through 2031, outpacing all other verticals
AI Chatbot Market Growth Projections
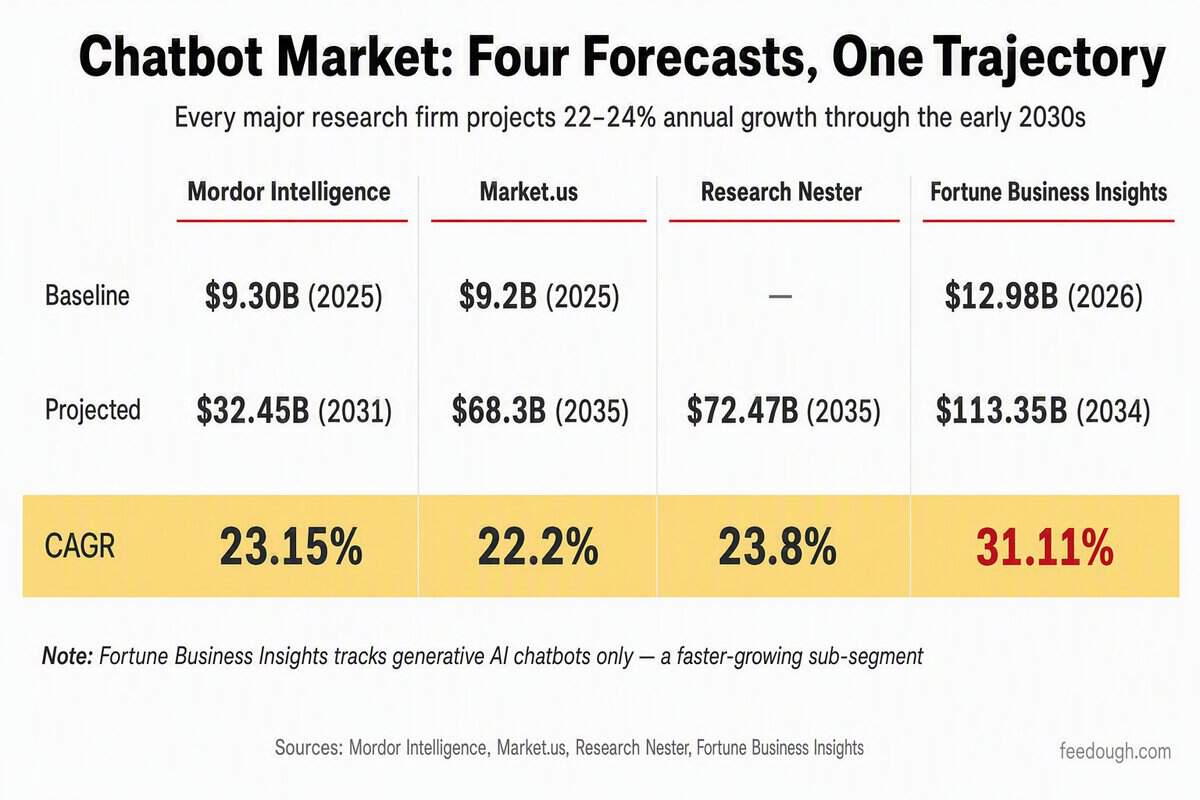
The global chatbot market was valued at roughly $9 billion in 2025, up from $8.7 billion the year before. Four research firms project it will reach $32 billion to $72 billion by the early 2030s. Every forecast converges on a 22% to 24% compound annual growth rate.
Research Firm | Baseline Value | Projected Value | CAGR |
|---|---|---|---|
Mordor Intelligence | $9.30B (2025) | $32.45B (2031) | 23.15% |
Market.us | $9.2B (2025) | $68.3B (2035) | 22.2% |
Research Nester | — | $72.47B (2035) | 23.8% |
Fortune Business Insights* | $12.98B (2026) | $113.35B (2034) | 31.11% |
*Fortune Business Insights tracks generative AI chatbots specifically. This sub-segment is growing at 31.11% CAGR, outpacing every overall market forecast. The gap reflects a faster shift from rule-based bots to large language model-powered agents than most projections anticipated.
AI Chatbot Growth Drivers and Adoption Statistics
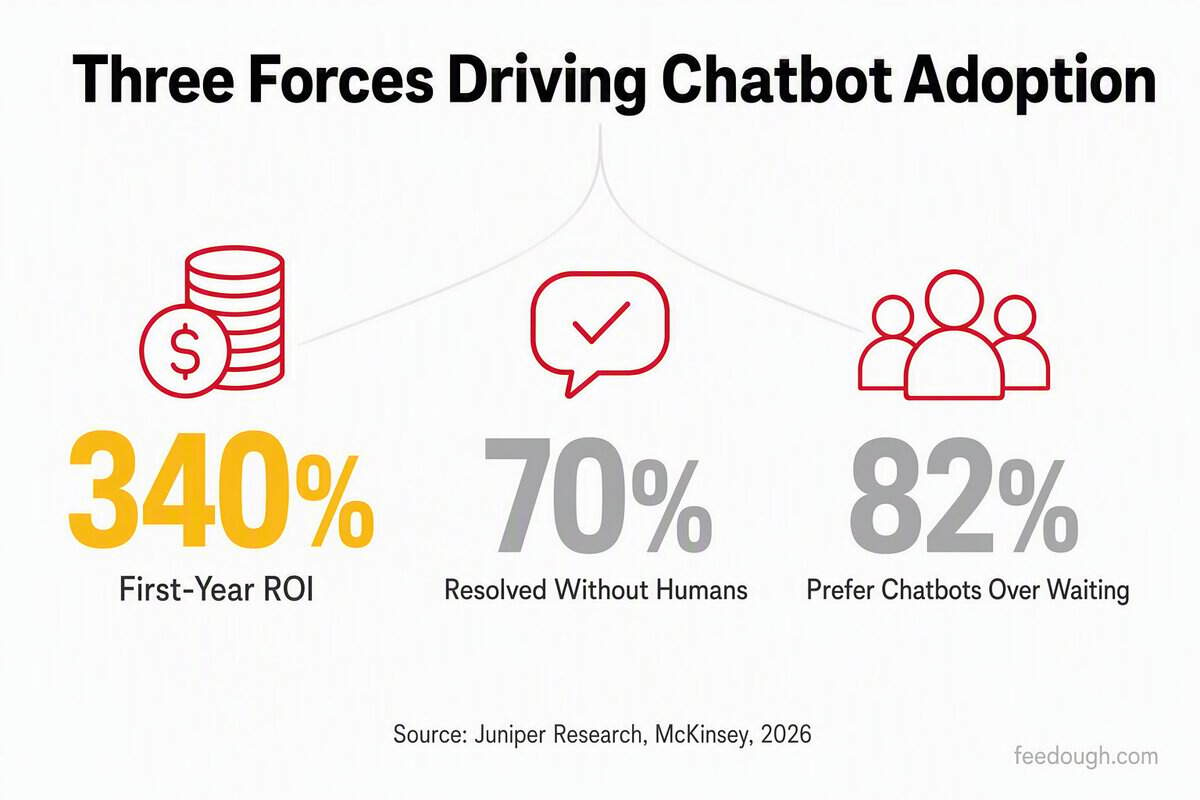
AI chatbot interactions cost $0.50 to $0.70 each. A human agent interaction runs $6 to $15. That cost gap is the foundation, but three forces are converging to push adoption past the tipping point: economics, capability, and consumer readiness.
- First-year ROI from chatbot deployment averages 340%, according to Juniper Research, while McKinsey data shows customer service costs drop 30% to 40% when AI handles routine queries
- Modern chatbots handle 70% of conversations from start to finish without human intervention, a leap from scripted decision trees that barely managed basic FAQs three years ago
- 82% of customers would use a chatbot rather than wait for a human agent, up from 62% in prior years; Gen Z consumers aged 18 to 25 show the strongest preference at 89%
Consumer Segment | Chatbot Preference | Trend |
|---|---|---|
Gen Z (18-25) | 89% | Highest preference of any age group |
General consumers | 82% | Up from 62% in prior years |
Boomers (58+) | Lowest share | Fastest growth at 15% year-over-year |
78% of companies have now implemented conversational AI in at least one core function, moving past the planning stage that defined 2024. Over 987 million consumers worldwide use AI chatbots today, and the feedback loop is self-reinforcing: cost savings fund better models, better models earn consumer trust, and trusted tools pull more businesses into deployment.
AI Chatbot Customer Satisfaction Statistics
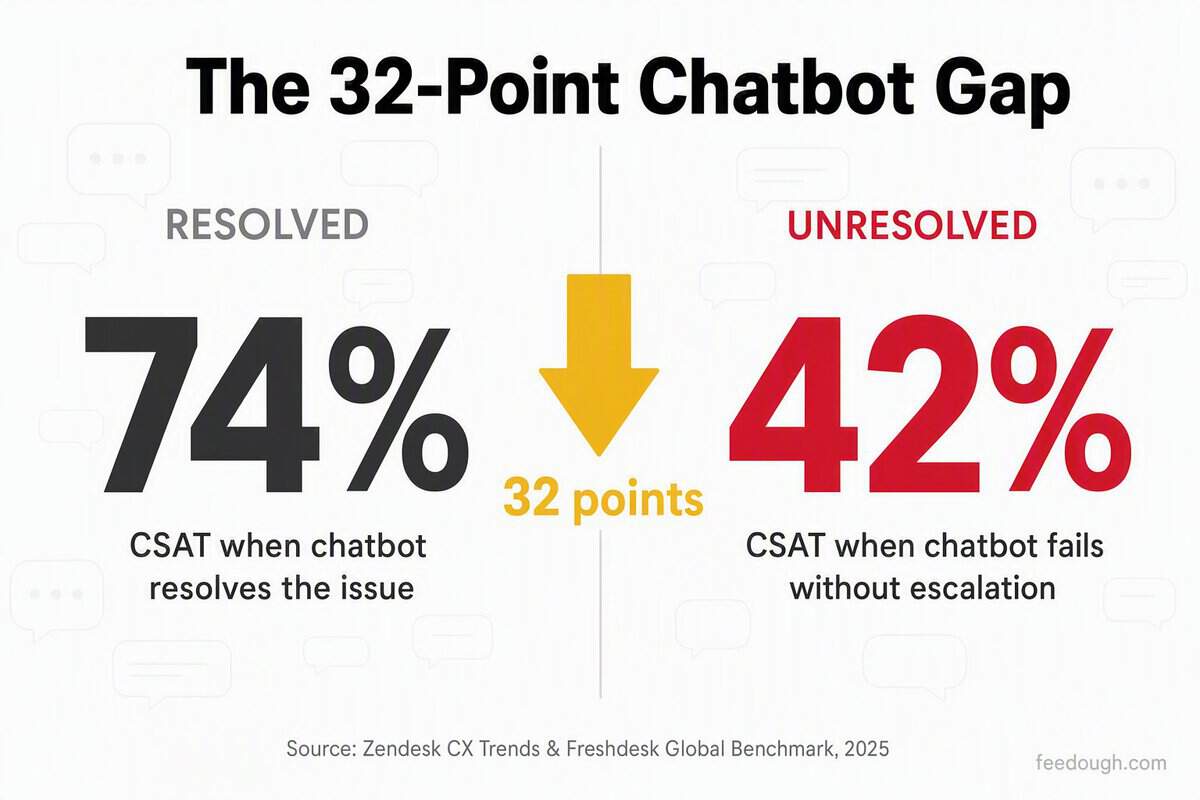
A chatbot that resolves the issue scores roughly 74% CSAT. A chatbot that fails and does not escalate to a human scores about 42%. That 32-point gap, not the headline averages, is what separates a useful chatbot from a costly one.
Industry | Resolution Rate | Key Constraint |
|---|---|---|
E-commerce | 82% | Product queries, order tracking, returns |
Banking & Finance | 75.2% | Regulated account inquiries |
Health & Pharma | 45.8% | Clinical specificity, regulatory limits |
AI chatbot customer satisfaction averaged 4.1 out of 5 across more than 220 million live chat interactions in 2025. Handoff to a human agent reached 92.6%, up from 86.7% the year before.
When escalation does not happen, the consequences are real:
- 68% of consumers have had a bad chatbot experience, typically when the bot could not answer their question
- 28% have abandoned a brand after a poor chatbot interaction
- Healthcare patient acceptance sits at just 27%, the lowest of any sector, even as AI adoption in the sector grows at a 36.8% CAGR
AI Chatbot Customer Expectations: Speed, Availability and Resolution Statistics
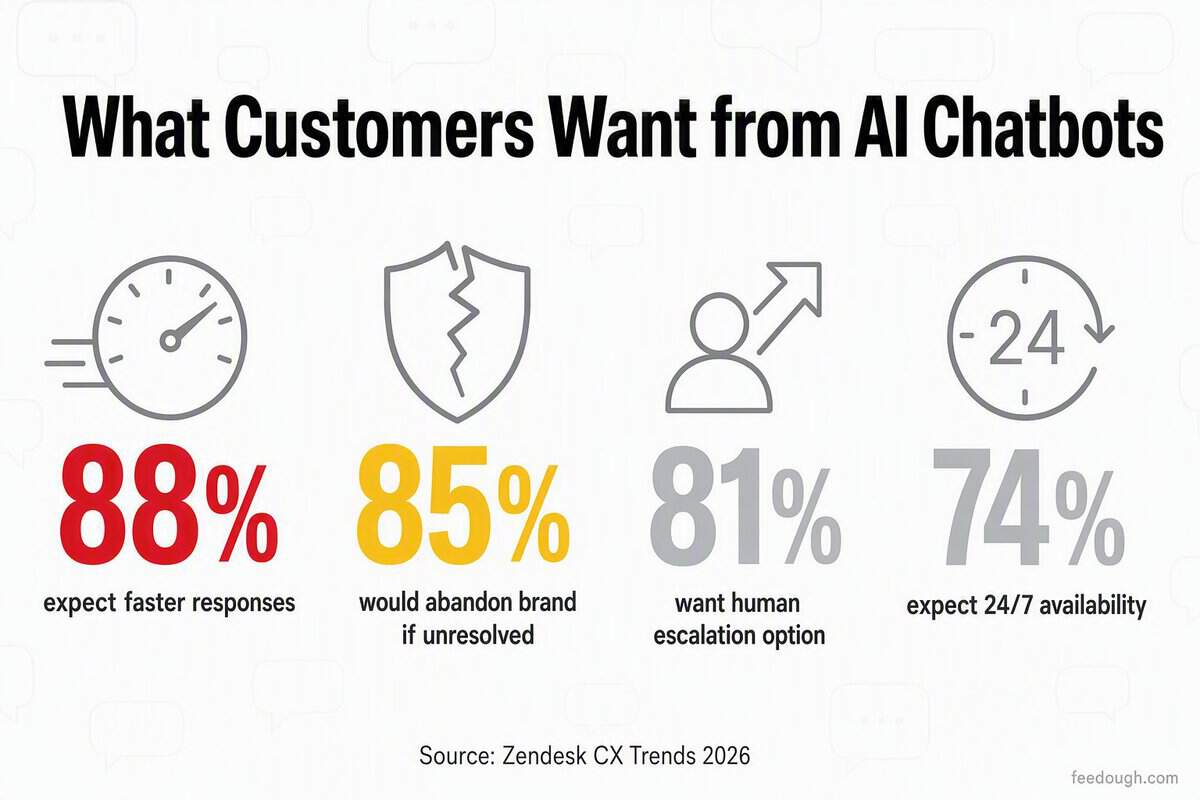
88% of customers now expect faster response times from customer service than they did just one year ago. The baseline has shifted, and what counted as fast in 2024 is already below the minimum.
Customer Expectation | Share | Source |
|---|---|---|
Expect faster response times than last year | 88% | Zendesk CX Trends 2026 |
Would drop a brand that fails first-contact resolution | 85% | Zendesk CX Trends 2026 |
Want option to escalate to a human at any point | 81% | Zendesk CX Trends 2026 |
Expect 24/7 customer service availability | 74% | Zendesk CX Trends 2026 |
Resolution is the expectation that carries the most consequences. A chatbot that answers quickly but cannot close the ticket still loses the customer: average chatbot CSAT sits at 72%, trailing human agents at 85%.
Speed is the easiest bar to clear. The hard part is finishing the job:
- Average AI chatbot response time is now under 3 seconds, surpassing the previous 5-second customer expectation
- AI-powered chatbots achieve 78% resolution rates versus 52% for rule-based systems, a 26-point gap that determines whether a chatbot earns trust or loses it
- The average resolution rate across industries is 69%, meaning nearly a third of conversations still require human escalation
Chatbot Use Cases and Industry Adoption Statistics
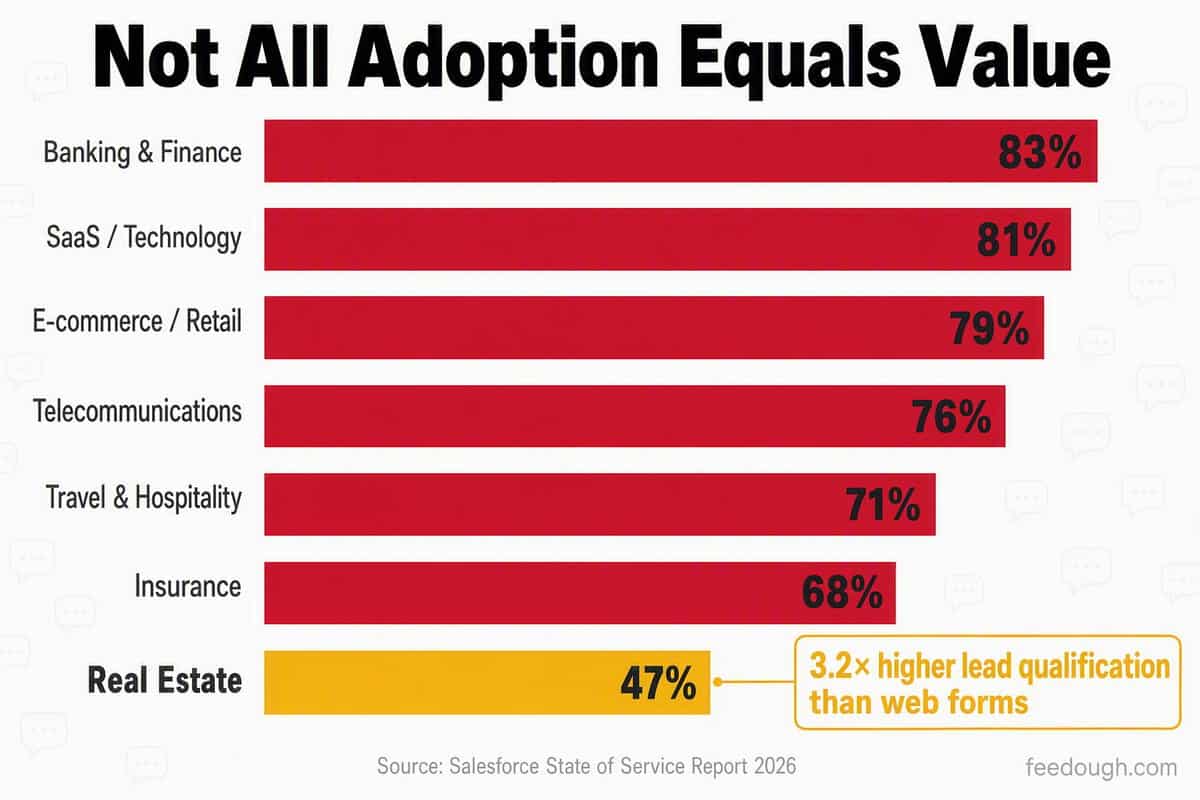
Banking and finance leads chatbot adoption at 83%. Real estate sits at just 47%. Yet real estate chatbots generate 3.2 times higher lead qualification rates than traditional web forms. The pattern repeats across sectors: the industries deploying chatbots fastest are not always the ones extracting the most value per interaction.
Industry | Adoption Rate | Primary Use Case |
|---|---|---|
Banking & Finance | 83% | Customer service automation |
SaaS / Technology | 81% | Support and onboarding |
E-commerce / Retail | 79% | Product recommendations, order tracking |
Telecommunications | 76% | Service inquiries |
Travel & Hospitality | 71% | Booking assistance, itinerary changes |
Insurance | 68% | Claims and policy inquiries |
Real Estate | 47% | Lead qualification |
These figures, drawn from Salesforce’s State of Service Report 2026, show where adoption has scaled. But adoption volume and per-interaction value diverge sharply. Banks and retailers deployed first because their customer base was already digital and support queries were repetitive. Real estate found higher return per interaction despite lower adoption: a single qualified lead is worth thousands in commission, making even a modest chatbot deployment profitable.
The sales-side metrics confirm where revenue impact concentrates:
- Chatbot-powered funnels convert 2.4 times more customers than static forms
- 55% of companies using chatbots for marketing report higher-quality leads
- 62.5% of businesses deploy digital assistants specifically for lead qualification
- Healthcare chatbots sit at 68% adoption, but the market is projected to grow from $101.8 million in 2025 to over $1 billion by 2035 at a 26.4% CAGR as scheduling and patient portal integrations mature
AI Chatbot Customer Service Performance Statistics
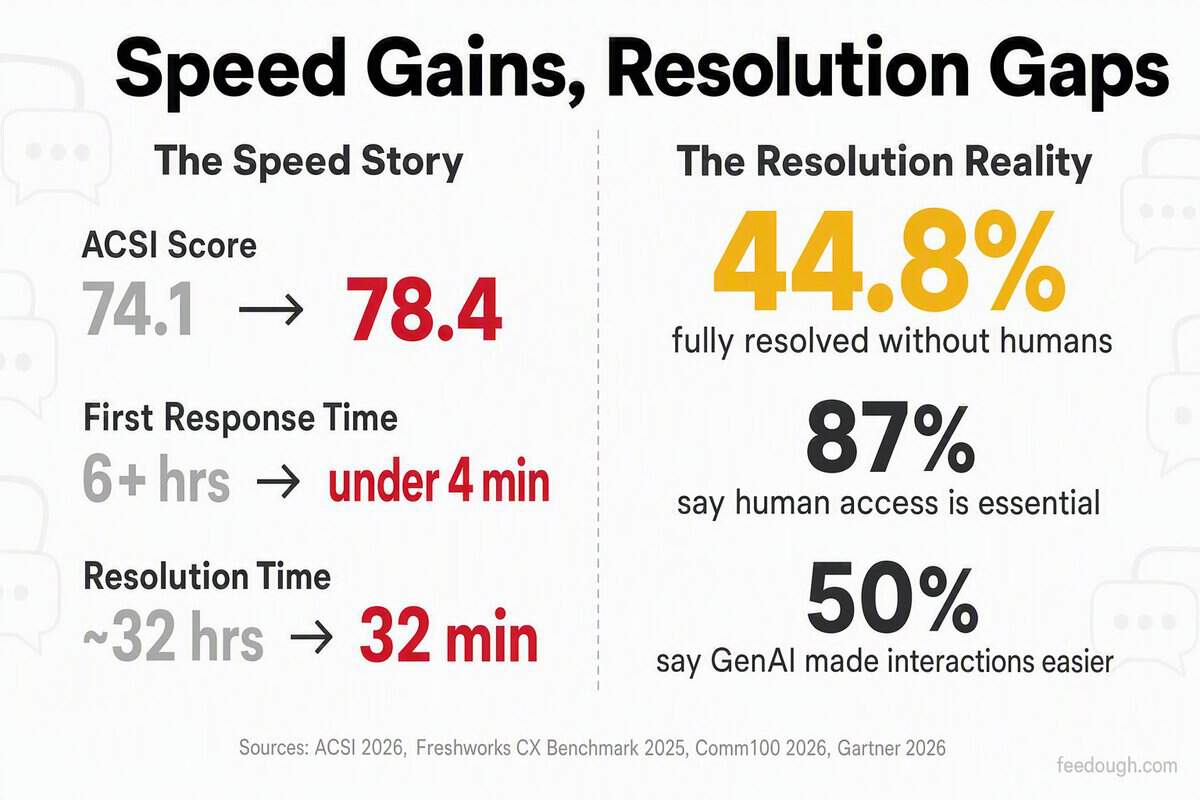
AI-assisted customer service scored 78.4 on the 2026 ACSI Index, surpassing human-only service at 74.1 for the first time. The milestone arrived alongside speed gains that would have been unthinkable two years ago.
Freshworks CX Benchmark 2025 data shows AI-powered support cut average first response time from over 6 hours to under 4 minutes. Average resolution times dropped from nearly 32 hours to just 32 minutes. When AI routing directed tickets to the right agent on the first attempt, handle times fell 40%, according to Five9 research.
Metric | Before AI | After AI |
|---|---|---|
Average first response time | Over 6 hours | Under 4 minutes |
Average resolution time | Nearly 32 hours | 32 minutes |
ACSI satisfaction score | 74.1 (human-only) | 78.4 (AI-assisted) |
But the speed story masks a resolution gap that the headline numbers obscure:
- AI chatbots fully resolved only 44.8% of chats without any human involvement, despite a 75.3% handling rate, according to Comm100’s 2026 benchmark across 220 million interactions
- Organizations with mature RAG deployments average 55% to 65% containment rates, while rule-based bots average only 20% to 35%, according to Gartner’s 2025 Customer Service Technology Survey
- 87% of customers consider human access essential when a company uses GenAI in customer service, yet only 50% said GenAI made their interactions easier, according to Gartner’s August 2026 data
AI Chatbot Sales and Lead Generation ROI Statistics
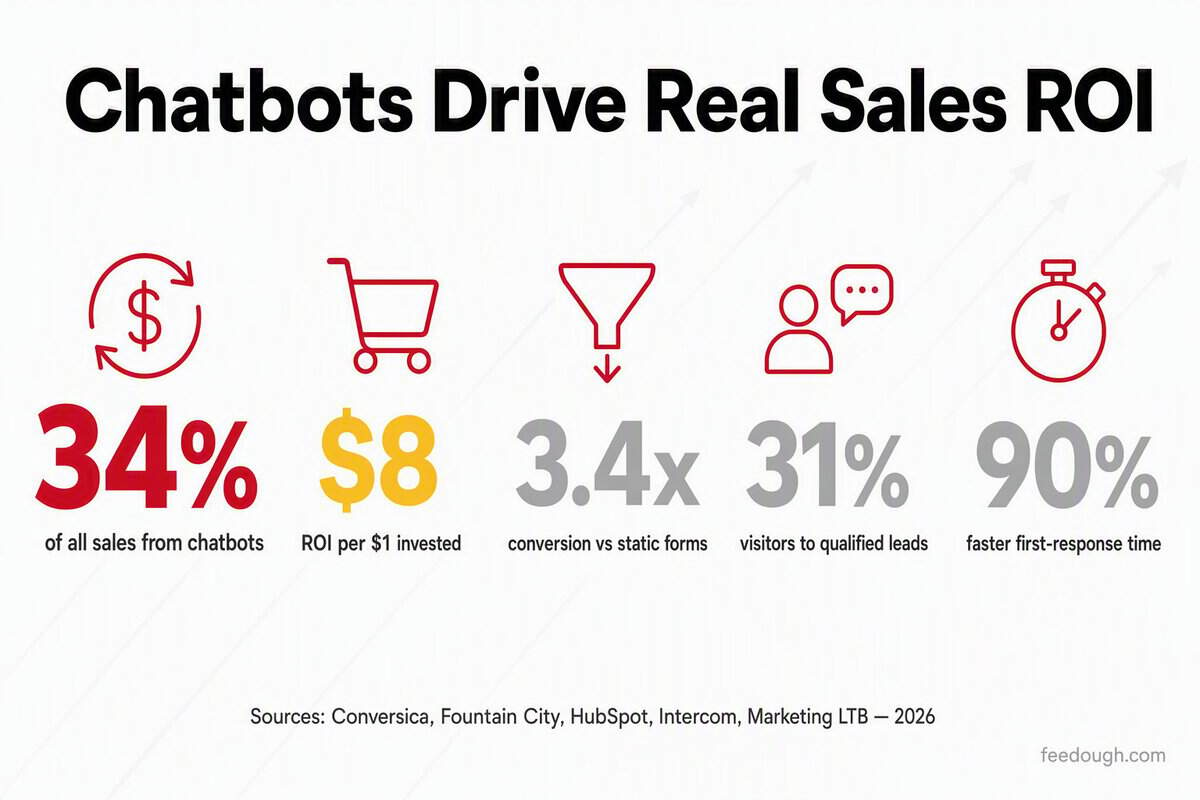
Chatbots generated 34% of all sales transactions in 2026, according to Conversica’s Revenue Execution Benchmark Study. The channel has moved well beyond cost savings. E-commerce chatbots now return 200% to 400% ROI in their first year, nearly double the range reported two years ago.
Sales Metric | Value | Source |
|---|---|---|
Share of sales from chatbot interactions | 34% | Conversica 2026 |
ROI per dollar invested (12 months) | $8.00 | Fountain City |
E-commerce chatbot ROI (first year) | 200%–400% | Shopify/GreetNow 2026 |
AI-assisted e-commerce conversion | 13.8% vs 3.4% | Rep AI & Adobe Analytics 2026 |
Proactive chatbot visitor-to-lead rate | 31% | Intercom 2026 |
- 80% average response time reduction from AI-enabled lead routing, with chatbots cutting first-response time by up to 90%
- Chatbot-generated leads convert at 3.4 times the rate of static forms and move through the funnel 5.2 days faster (HubSpot 2026)
- Companies using AI for lead prioritization see 35% higher conversion on hot leads
- Enterprise chatbots reach positive ROI in 6 to 9 months; SMB chatbots hit the same mark in 2 to 4 months
AI Chatbot Content Creation and Productivity Statistics
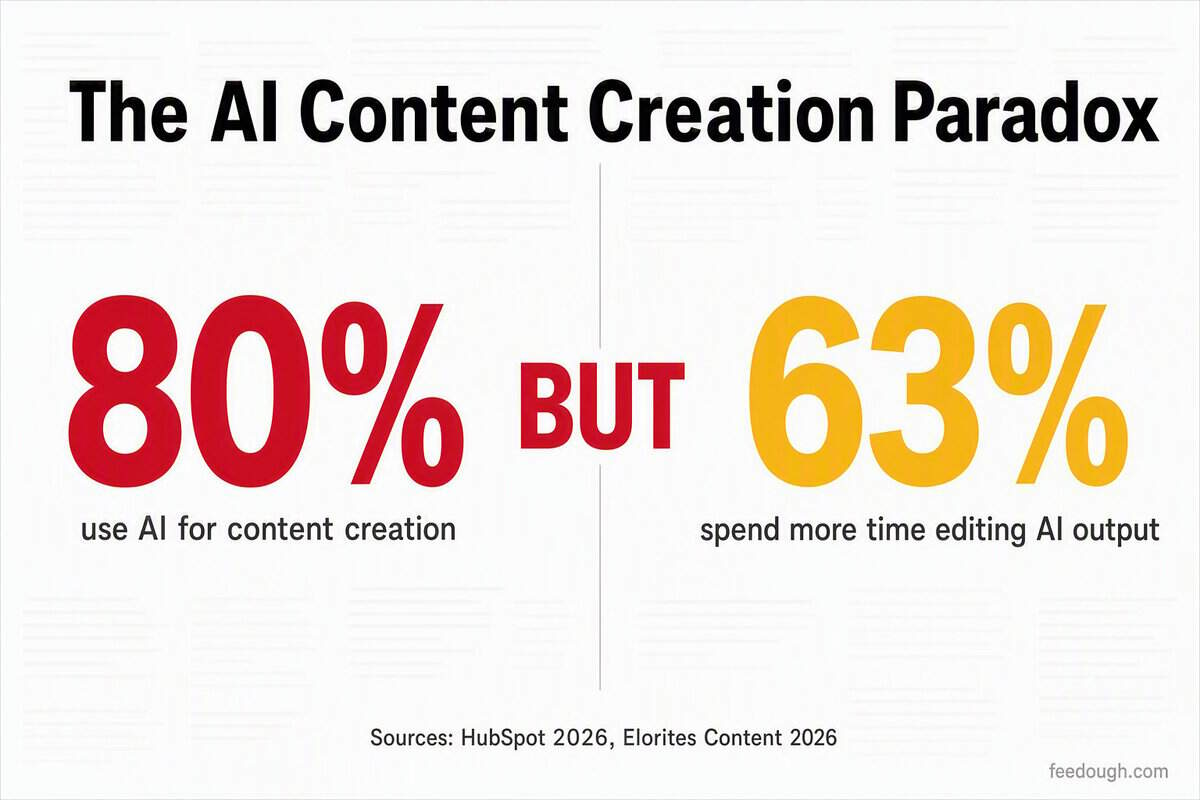
80% of marketers now use AI for content creation. But 63% of content writers report spending more time editing AI output than they ever spent writing from scratch. The productivity gains are real; the editing burden is the part nobody budgets for.
Content Creation Metric | Value | Source |
|---|---|---|
Marketers using AI for content creation | 80% | HubSpot 2026 |
Marketers using AI for media production | 75% | HubSpot 2026 |
People using chatbots for writing or editing tasks | 23% | Consumer Reports |
Content writers spending more time editing AI output | 63% | Elorites Content 2026 |
Average hours saved per piece of content | 3 hours | AutoFaceless |
The time savings from AI-assisted drafting are real, but the bigger return comes from brand consistency. McKinsey surveyed 2,400 mid-to-large companies for its 2026 Brand Performance Index. Organizations combining AI-powered governance with consistent cross-channel messaging reported revenue increases averaging 33.7%.
- AI-adopting businesses report a 55% boost in customer engagement through better personalization and more relevant content delivery
- Social media posts with a consistent brand voice get 23% more engagement than inconsistent messaging
- 53% of US shoppers abandon carts due to conflicting or inconsistent product information
- 68% of businesses report increased content marketing ROI directly attributable to AI tools
The editing paradox is the gap most teams discover after deployment. AI accelerates the first draft, but the post-draft burden shifts to brand enforcement, factual verification, and tone alignment. Teams that solve that editing problem with governance tools capture the full ROI. Teams that do not end up with faster drafts and the same fragmented voice they had before.
AI Chatbot Business Impact and ROI Statistics
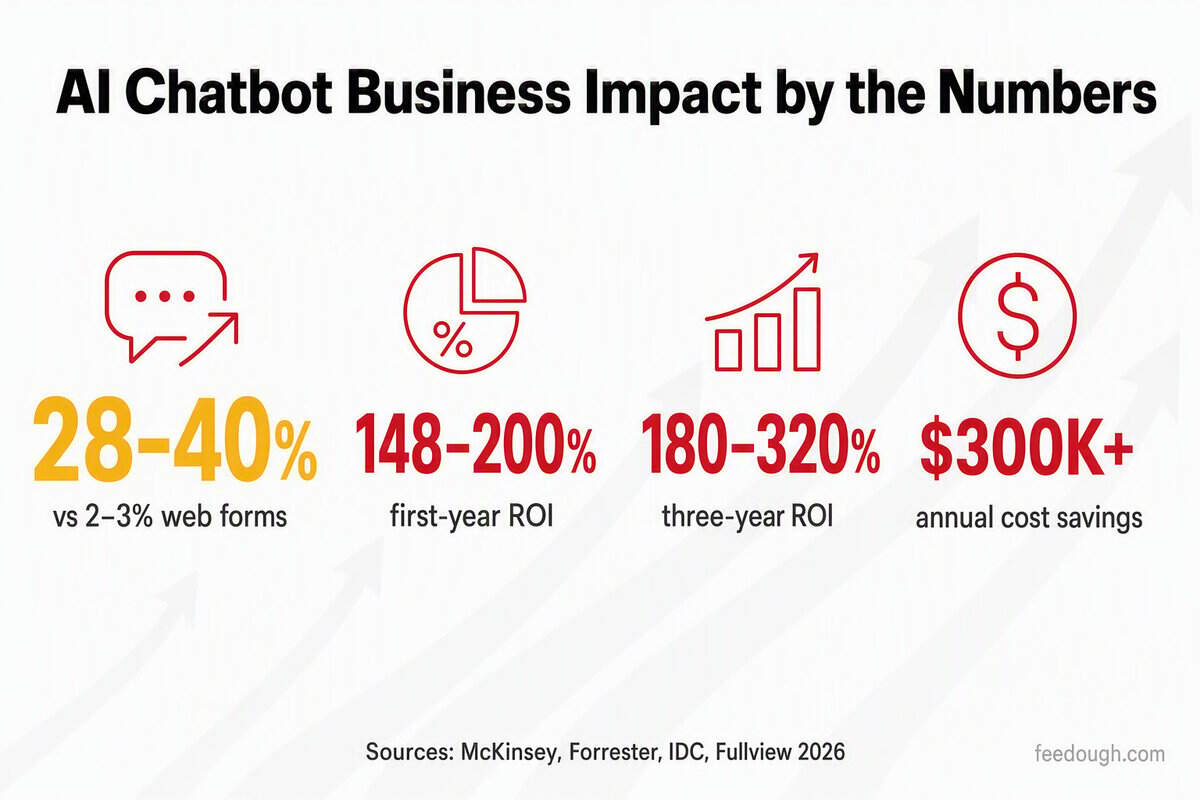
Only about one-third of organizations have scaled AI chatbots beyond isolated pilots. The two-thirds still on the sidelines are leaving measurable returns on the table. Chatbot-generated qualifiers convert at 28% to 40%, compared to just 2% to 3% for traditional web forms.
Business Metric | Value | Context |
|---|---|---|
AI chatbot qualifier conversion rate | 28%–40% | vs 2%–3% for web forms |
First-year ROI | 148%–200% | Fullview 2026 report |
Three-year ROI | 180%–320% | McKinsey, IDC, Forrester TEI studies |
Annual cost savings (leading implementations) | $300,000+ | Fullview 2026 report |
Enterprise payback period | 9–12 months | 40+ enterprise deployments |
67% of Fortune 500 companies have deployed AI chatbots. 91% of enterprises with 50 or more employees use them. Yet only 6% qualify as AI high performers, according to McKinsey’s State of AI 2025 survey.
The gap between deployment and profit is not about technology access. It is about which business function the chatbot targets first. Companies earning the highest returns focus on conversion and cost reduction, then expand into adjacent use cases with the savings.
Sources
- https://elfsight.com/blog/chatbot-statistics-and-trends (2025)
- https://www.ringly.io/blog/chatbot-statistics-2026 (2026-06-03)
- https://sqmagazine.co.uk/ai-tools-usage-statistics (2025)
- https://aibusinessweekly.net/p/ai-adoption-statistics (2026)
- https://www.tidio.com/blog/chatbot-statistics (2026-01-01)
- https://greetnow.com/blog/chatbot-statistics (2026-01-07)
- https://mangothrive.com/how-many-people-use-ai (2026)
- https://www.mordorintelligence.com/industry-reports/global-chatbot-market (2026)
- https://www.aboutchromebooks.com/conversational-ai-market-statistics (2025-06-17)
- https://market.us/report/chatbot-market (2025-08-01)
- https://www.precedenceresearch.com/chatbot-market (2025)
- https://azumo.com/artificial-intelligence/ai-insights/ai-chatbot-statistics (2026-08-17)
- https://masterofcode.com/blog/chatbot-statistics (2026-01-01)
- https://hyperleap.ai/blog/ai-chatbot-statistics-2026 (2026-06-02)
- https://www.chatbot.com/blog/chatbot-statistics (2026-01-01)
- https://adai.news/resources/statistics/ai-chatbot-statistics-2026 (2026-01-01)
- https://www.comm100.com/blog/what-percentage-of-chats-can-ai-chatbots-resolve (2026-03-12)
- https://merren.io/blogs/what-is-good-csat-score (2026)
- https://www.nextiva.com/blog/customer-service-statistics.html (2026)
- https://cxtrends.zendesk.com/ (2026-01-01)
- https://peaksupport.io/wp-content/uploads/2025/04/Key-Performance-Indicators-E-book-KPI-Benchmark-2025.pdf (2025-04-01)
- https://www.marketresearchfuture.com/reports/healthcare-chatbots-market-6476 (2026-09-07)
- https://www.noupe.com/blog/ai-chatbot-statistics (2026-05-01)
- https://www.freshworks.com/How-AI-is-unlocking-ROI-in-customer-service/ (2025-04-01)
- https://www.amraandelma.com/top-ai-chatbot-customer-service-statistics (2026)
- https://www.edesk.com/blog/ai-customer-service-works (2025)
- https://www.cekura.ai/blogs/containment-rate (2026-08-01)
- https://heeya.fr/en/blog/ai-chatbot-kpis-metrics-guide-2026 (2026)
- https://chatmaxima.com/blog/ai-customer-support-statistics-2026 (2026-01-01)
- https://www.digitalapplied.com/blog/ai-customer-support-statistics-2026-adoption-roi-data (2026)
- https://marketingltb.com/blog/statistics/chatbot-statistics (2026)
- https://www.amraandelma.com/ai-chatbot-conversion-rate-statistics (2026)
- https://greetnow.com/blog/lead-response-time-statistics (2026)
- https://www.amraandelma.com/brand-consistency-roi-statistics (2026)
- https://www.omnibound.ai/blog/brand-consistency-statistics (2025)
- https://firewiredigital.com.au/learn/content/ai-writing-statistics (2026)
- https://eloritescontent.com/research/impact-of-generative-ai-on-content-writing-industry (2026)
- https://thestacc.com/blog/ai-content-marketing-statistics (2026)
- https://thestacc.com/blog/state-ai-marketing (2026)
- https://colorwhistle.com/ai-chatbot-statistics (2026-08-20)
- https://valueaddvc.com/blog/how-enterprises-are-calculating-ai-roi-in-2026-the-frameworks-cfos-are-actually-using (2026-05-31)
- https://agencypartner.com/benefits-of-ai-chatbots-for-business-2026 (2026)