[Reader Disclosure]Our content is reader-supported. This means we may earn a commission if you click on some of our links.
The human brain processes an image 60,000 times faster than text and can quickly identify an image seen for as little as 13 milliseconds. This fact was the reason why marketers made a shift towards sharing information visually.
Whether you are a marketer, student, or a teacher; to make an infographic, you need three things to get started:
Ideas – The idea is a formulated thought you would like to share with your audience. It decides what the entire presentation is going to be about – it is the spine of your infographic.
Platform – Not all platforms are custom-fit for all types of presentations. For instance, Visme is suitable for data-oriented infographics, Adobe Illustrator is good for professional ones, and Canva is excellent for all kinds of creative infographics.
Information – Information brings that conceptualisation to reality and helps you convert the idea into a visual explanation. It includes the key facts, visuals, data, and more information that will support your idea and keep your audience engaged.
Creating good infographics is a crucial skill for marketers to communicate better with the audience. And creating one isn’t hard once you know the proper steps and have the apt infographic tools to create it.
An Infographic (a.k.a. Information graphic) is a visual representation of data, information, or knowledge. It concisely presents complex information using data visualisations and imagery, like pie charts, graphs, steps and minimal text to illustrate data visually.
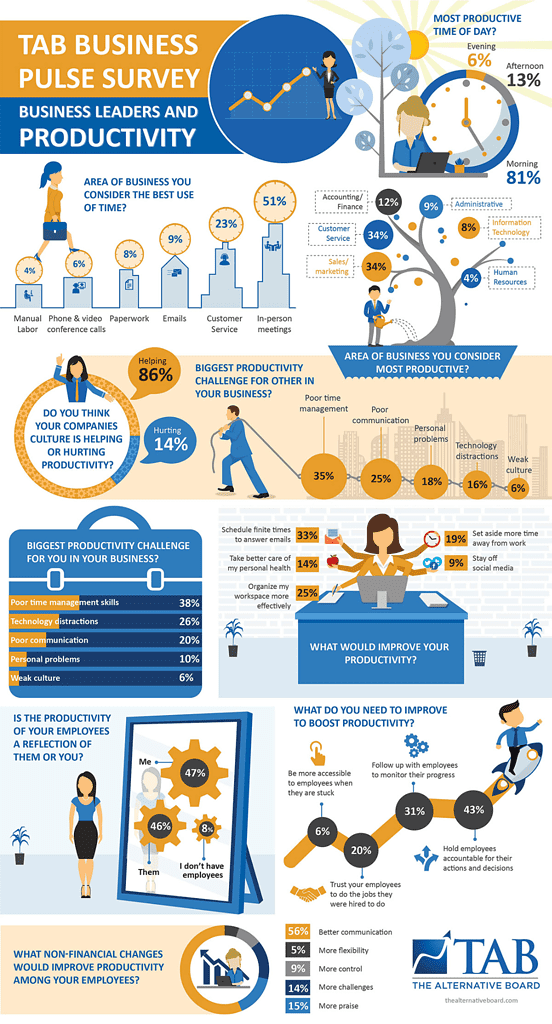
Since infographics are easy to understand, they can be used to present information on scientific concepts, historical events, and statistical data. You can also share them with a wide audience quickly.
For instance, it is much easier to understand this complex business pulse survey in this infographic than it would have been on sheets.
How To Make Infographics – Step-By-Step Process
No matter the topic’s complexity, anyone can make an infographic, given the right steps and tools. Here are the six simple steps to follow when creating an infographic:
Identify The Audience
If you create an infographic to please everyone – you end up pleasing no one.
When you are making an infographic – it is essential to know:
What technical terms, lingos, and jargon can you use
For instance, if your audience is your team, you skip adding basic details, be strategic, and go more in-depth. However, if your target audience is interns, you need to create a build-up.
Identify The Goal Of Your Infographic
The goal of an infographic can be many. It can be creating different types of infographics, including:
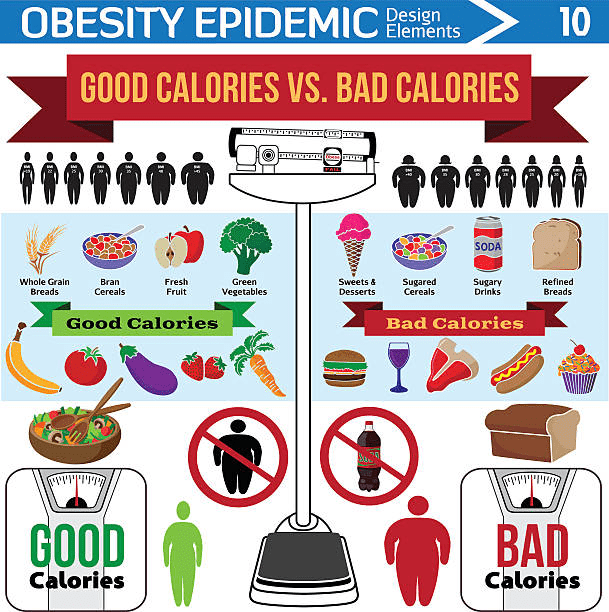
Comparison Infographic
Comparison infographics that explain the complex and minor differences visually help the audience to comprehend differences effectively. For instance, this infographic makes the difference between good and bad calories and their consequences easy to understand.
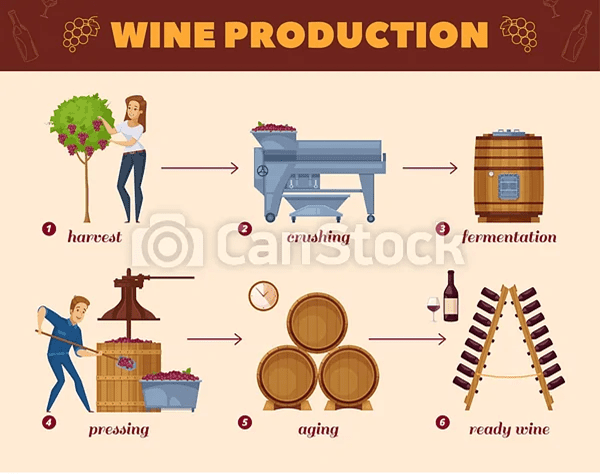
Flowchart Infographic
Flowchart infographic makes it easier to understand the entire process and its work in just one glance. For instance, this image makes the whole process of wine production very clear in just one appearance.
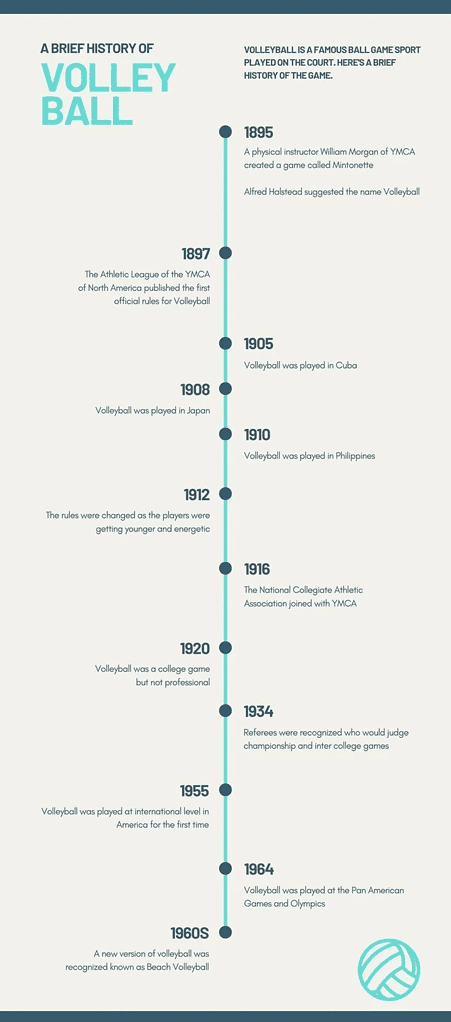
Timeline Infographic
Timeline infographics make it easier to display information in time progression content visually. For instance, this infographic below shows the entire history of volleyball from 1985 to the 1960s in one shot.
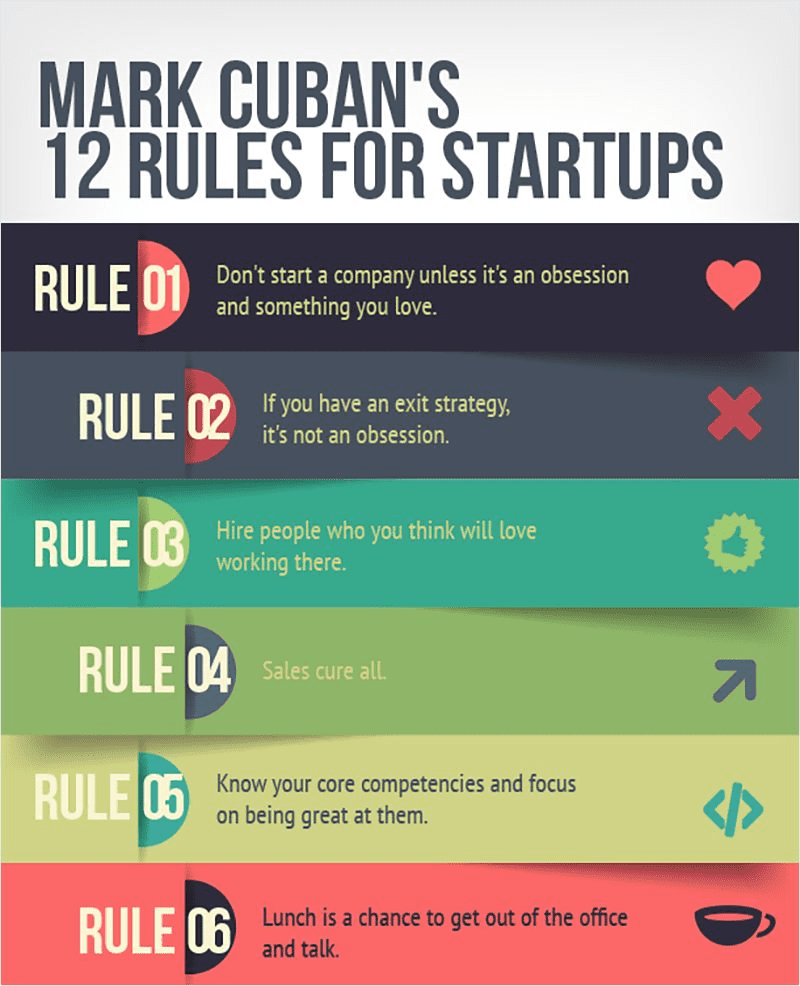
Listicle Infographic
Timeline infographics make it easier to display information in time progression content visually. For instance, this infographic below shows the 12 rules Mark Cuban follows to ensure his startups succeed.
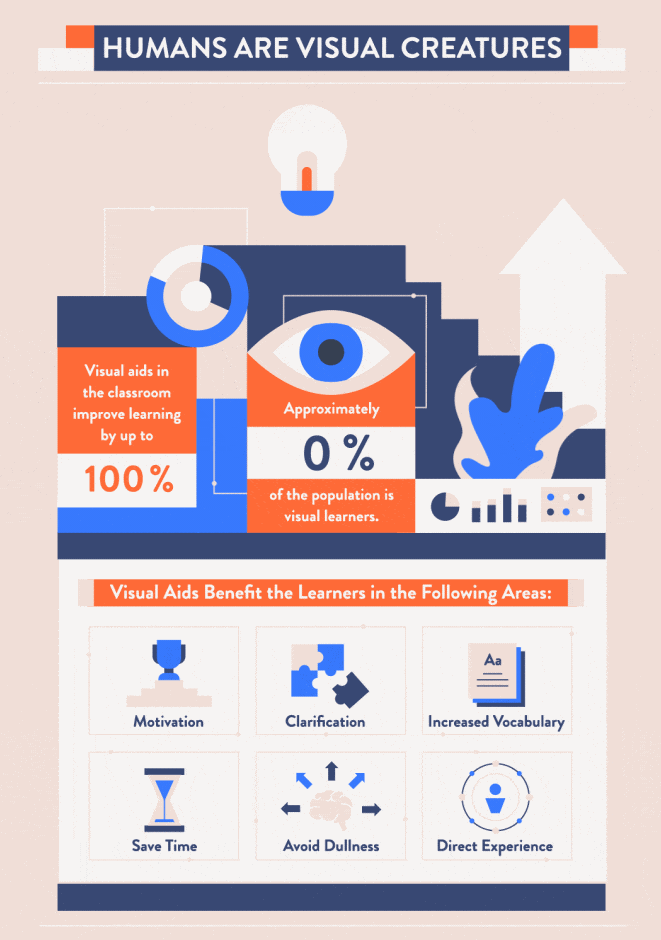
Educational Infographic
Educational infographics help businesses and educational institutes relay information in a logical and visual way. For instance, this infographic very well explains why humans are visual creatures and how it benefits learning.
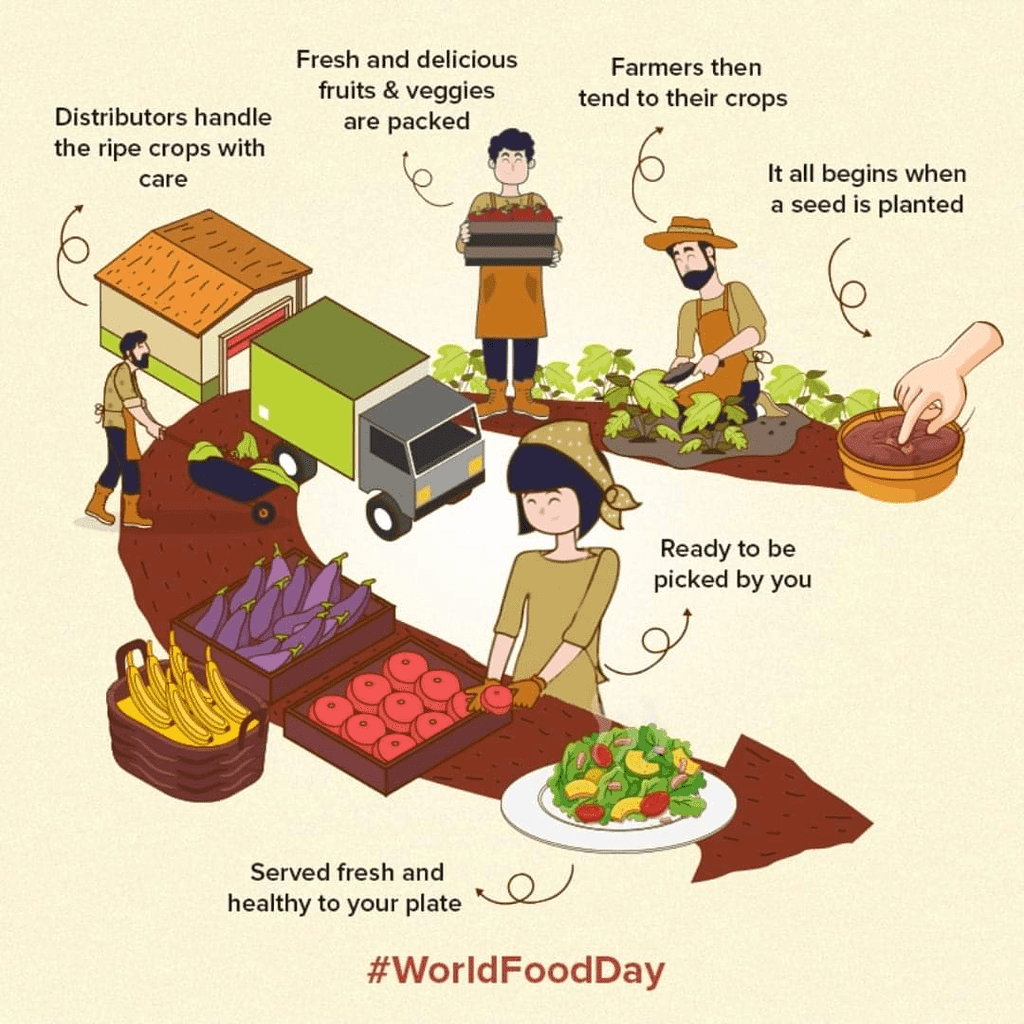
Process Visualisation Infographics
Process-oriented infographics make it effortless to understand a process in a go. This infographic I found on World Food Day is an excellent example of a process explained well. It walks us through each step it takes to get us food – from seed to food on the plate.
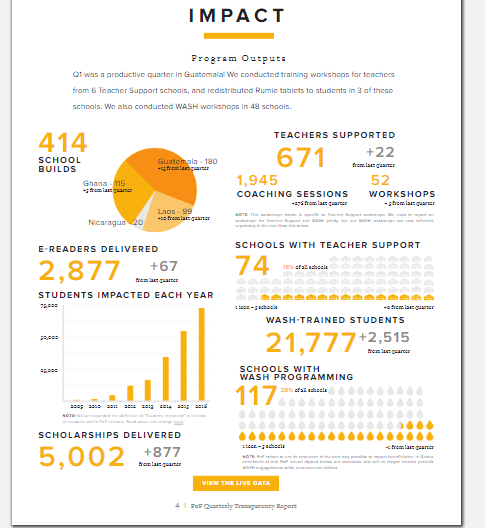
Project Impact Report Infographic
Project impact report infographics explain different areas of success, failures, areas of improvement, and all other data and stats in just one image, dismissing the need to go through those heavy excel sheets. For instance, this infographic using different data explains the output of a program.
Fetch Data For Your Infographic
When preparing an infographic, the data you present to your audience must be real and existential to create meaningful infographics. You can not add the general information available on the internet.
So, the question is, what is the best place to get authentic data?
It depends on the type of infographic.
If it’s internal – get data from your departments.
If you plan to create an infographic on external data or stats, websites and research companies like Statista, Gartner, Pew Research, CB Insights, etc. could be your go-to data platforms. Or you can simply start with “*niche* statistics” Google search to start with your research.
Always remember to use legitimate data for your infographic and add source somewhere on the image.
Create A Logical Layout Of Your Infographic
The first breakthrough with making an infographic is hard. That is why you must create an outline or layout and structure your information and data first.
Decide the hierarchy, where to add which data, what text to add with which image, and plan your entire infographic.
Doing this will give you clarity over the project and help you create a visually appealing infographic.
Convert Data Into Visuals
Once you have your data, you will have to decide how you want to represent it visually. You can do this in three ways:
Create the entire infographic yourself using expert-oriented software like Adobe Photoshop, Illustrator, etc.
Get the help of a designer. You can go to marketplaces like Fiverr or find an expert design freelancer through platforms such as 99Designs.
Go with Adobe creative suite if you have the expertise. It offers a lot of features and options, so you can create anything from a simple one-page infographic to a more complex one with multiple sections.
But if you don’t have the time or money to learn it, get professional help or go for template-based solutions.
Freelancers are usually time-efficient, and their work quality is often just as good (if not better) than what you can get from professional designers. Plus, they’re more likely to be able to customise your infographic according to your needs. 99Designs is a good place to start for designer freelance hunting.
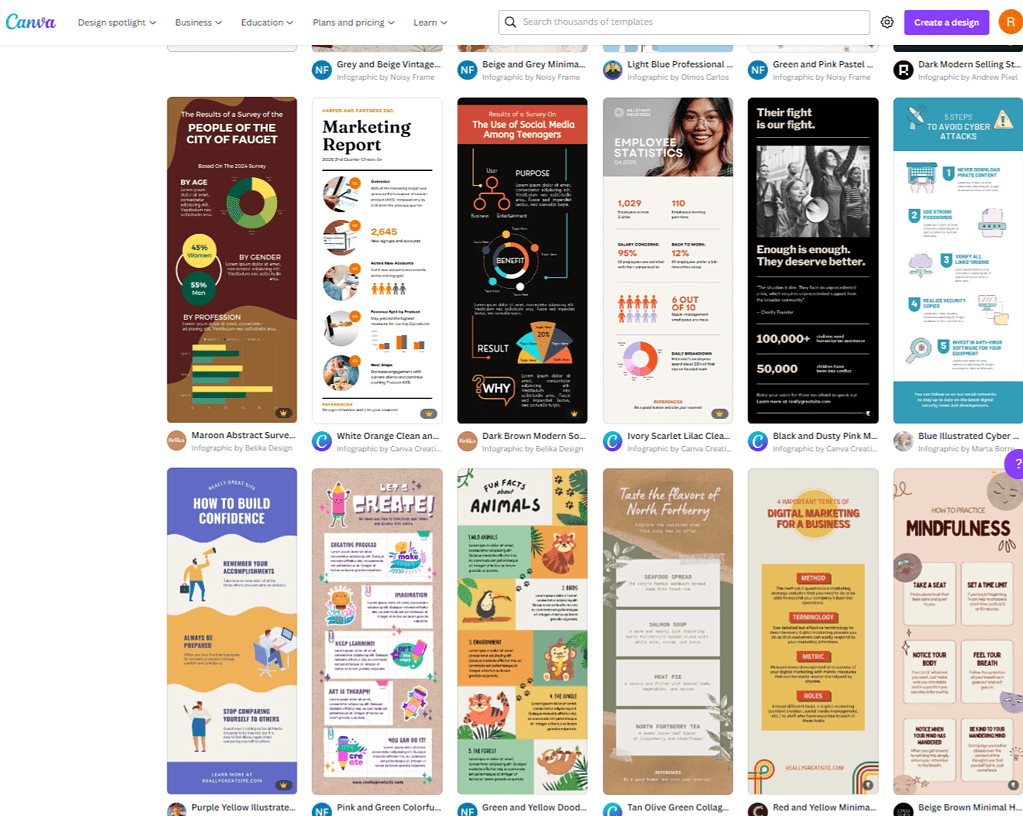
But freelancers can be costly, so if you need to keep your budget lower, then go for template-based software. This type of software includes options such as Canva and Visme, both offering plenty of features to create beautiful infographics with minimal effort.
To create an infographic on Canva:
In your Canva account, click on ‘create design’
In design the editor, click on the ‘Uploads’ tab and select – the ‘Upload your own images’ options
Click on the ‘Browse’ button to find the data sheets, including google sheets, excel, or more, from which you want to import the data.
After uploading the file, you can resize, crop, or add filters to the images
To import data into Visme, follow these steps:
Click on the Import Data tab on the left
Choose the source from which you want to import data – google Sheets, excel or more.
After you have added the link to the file or uploaded the excel sheet, get your graph ready to customise and use.
To make an infographic, all you have to do is follow these five steps.
Identify The Audience
Identify The Goal/Type Of Your Infographic
Fetch Data For Your Infographic
Create a logical Layout Of Your Infographic
Convert Data Into Visuals
The best part? You don’t need to be a designer to convert your data into visuals. Ensure you know what you’re doing, align the data logically, and use good templates to create an infographic.
Go On, Tell Us What You Think!
Did we miss something? Come on! Tell us what you think about our article on how to make an infographic in the comments section.
Ravpreet is an avid writer, prone to penning compelling content that hits the right chord. A startup enthusiast, Ravpreet has written content about startups for over three years and helped them succeed. You can also find her cooking, making singing videos, or walking on quiet streets in her free time.
Each week I share research backed AI oriented content in my newsletter.
There are AI ideas, AI trends, tutorials, and guides.
24k entrepreneurs read it. I'd love you to join.