[Reader Disclosure]Our content is reader-supported. This means we may earn a commission if you click on some of our links.
It’s a proven fact that the human brain is more attracted to visuals than plain text. People understand visuals faster and remember them for a longer duration. This is where infographics come into play.
Consider infographics as the modern-day equivalent of a poster. It’s an easy-to-comprehend visual representation of data, facts and figures that helps communicate complex information quickly and clearly.
But, for a newbie, ‘infographic’ could probably be an unveiled word. Here’s a guide that explains everything about infographics – from their definition to different types of infographics, examples, design tips and templates.
An infographic (information graphic) is a visual representation of information, data, and facts in an easy-to-digest format intended to present information concisely and quickly.
It includes visuals like graphs, charts, maps, icons, and illustrations that make complex information easier to understand and interpret.
Infographics are used in various fields such as business, marketing, education etc. and are shared widely across social platforms like Twitter, Instagram, and Facebook.
They are often used to explain a topic, products or services and to convey important messages using visuals.
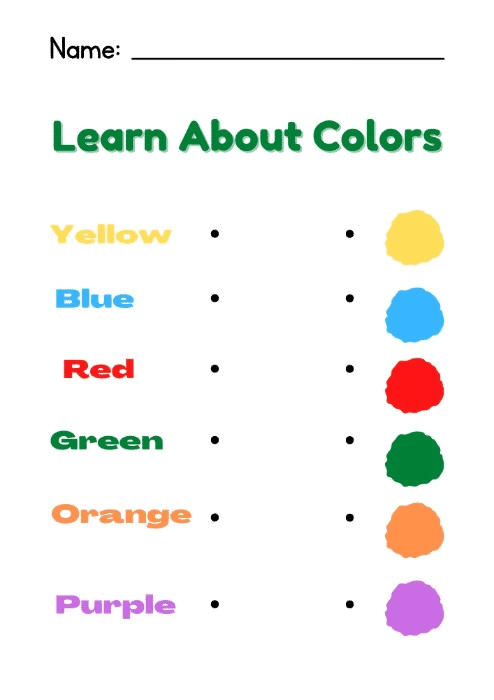
For instance,
It is easier for a teacher to explain colours to students using an infographic than describing them in words.
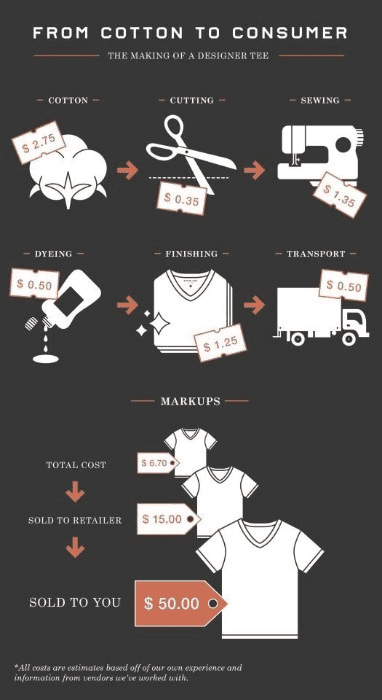
Similarly, a marketer can break down the pricing of a cotton t-shirt right from when it was a cotton ball to the shop shelf using an infographic.
Infographics stand out and are made for a purpose, as they make difficult topics more accessible by breaking them down into visually appealing pieces of content.
The Purpose Of An Infographic
Infographics are used to simplify complex topics and present them in an easy-to-understand format.
This allows readers to digest information quickly, understand it better, remember it longer and even share it with others.
The purpose of infographics is to communicate information quickly and effectively by combining icons, charts, images, text and colour to convey a message.
Marketers use infographics to:
Educate their audience
Draw attention to important information like business achievements
Make points more clear using infographics that include stats, graphs, and more
Deliver every day, weekly, monthly, or just regular project update reports to clients
Small businesses and entrepreneurs use infographics to:
Create a style guide for the brand
Highlight their offerings – products or services
Promote business
Showcase expertise on an industry-relevant topic to engage the audience
Create better visual assets
Nonprofit organisations use infographics to:
Raise awareness about a cause and the impact of a work
To show data and statistics on the impact of a fundraiser that can be sent to donors
Explain a cause in an easy and understandable way
Prepare a visual impact report to showcase the success
Government use infographics to:
Circulate information about policies, programs, and services to the public
Share census data and statistics to support a points
Outreach, educate, and engage citizens about important issues
Similarly, infographics find their use in other industries like healthcare, education, entertainment, and more.
Types Of Infographics
Infographics are powerful tools to increase engagement with the audience, which helps to boost communication effectiveness.
Today almost every industry leverages these visual assets to convey complex information more quickly, attract more attention and draw more recognition.
Here are some creative examples of how businesses use infographics:
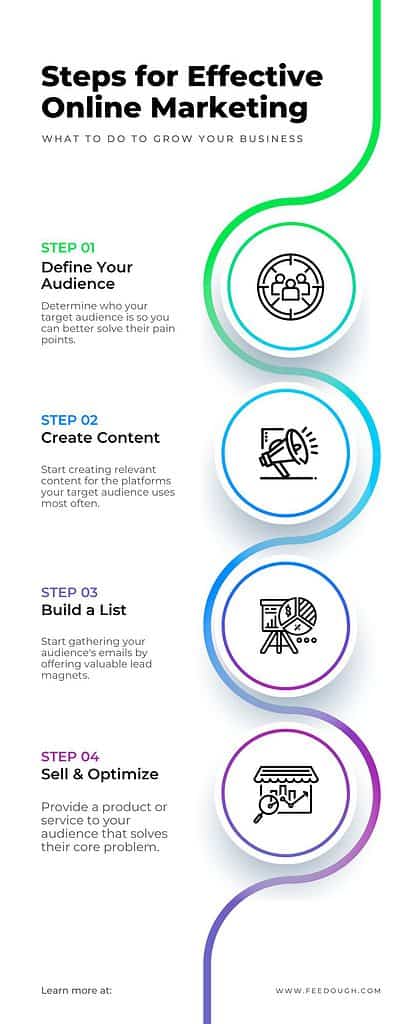
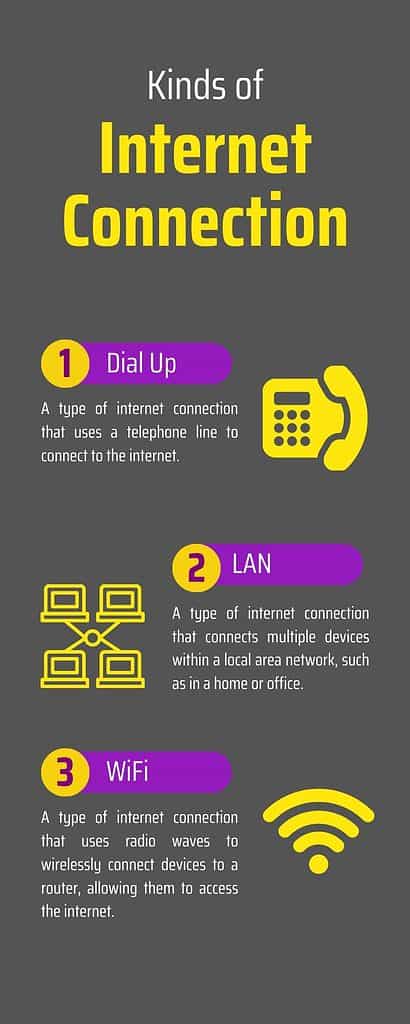
Guides Infographic
Guides infographics are intended to provide a general overview of the topic without going too much into detail.
They’re usually composed of reference points, steps and/or processes of information and represent a visual journey.
Scientific Data And Research Infographic
Scientific infographics are designed to represent complex data in a visually appealing way.
Organisations use these visuals to explain their research and findings in a more comprehensive manner, without relying on words alone.
This type of infographic is often used to represent statistics and facts, as well as to illustrate the correlation between different factors.
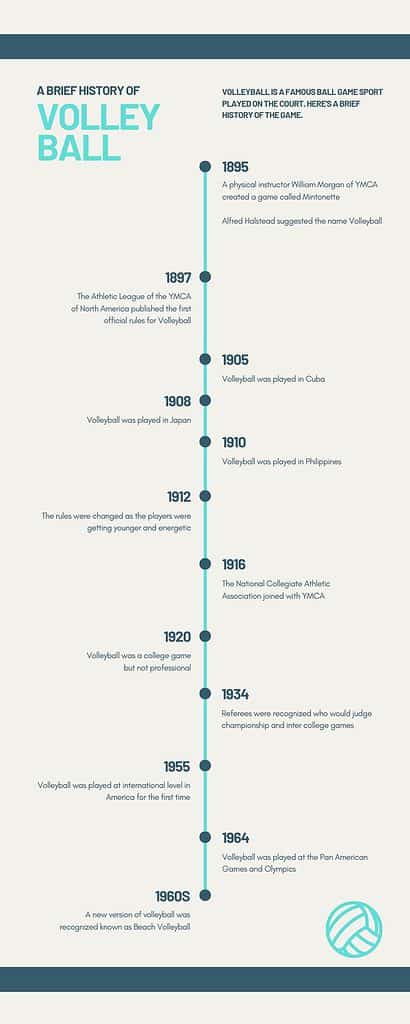
Historical Events And Timelines Infographic
Historical infographics are used to represent the events and developments of a particular period.
These visuals may be composed of timelines, maps and visuals that explain the various advancements or occurrences over time.
By representing historical information in an infographic format, organisations are able to draw attention and interest to these stories while simplifying their complexity.
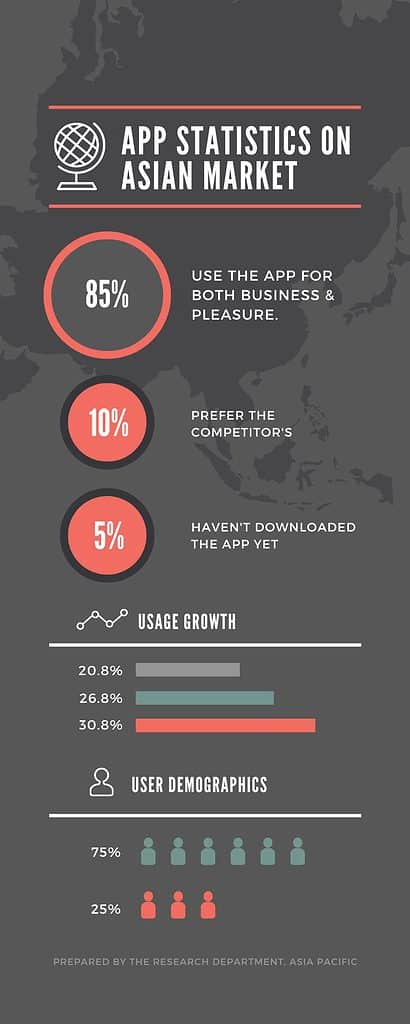
Statistical Information Infographic
Statistical infographics are used to represent the data and findings of research or studies.
They can be used to illustrate trends, demonstrate correlations between variables, compare different sets of information and incorporate hard facts and figures into visual representations.
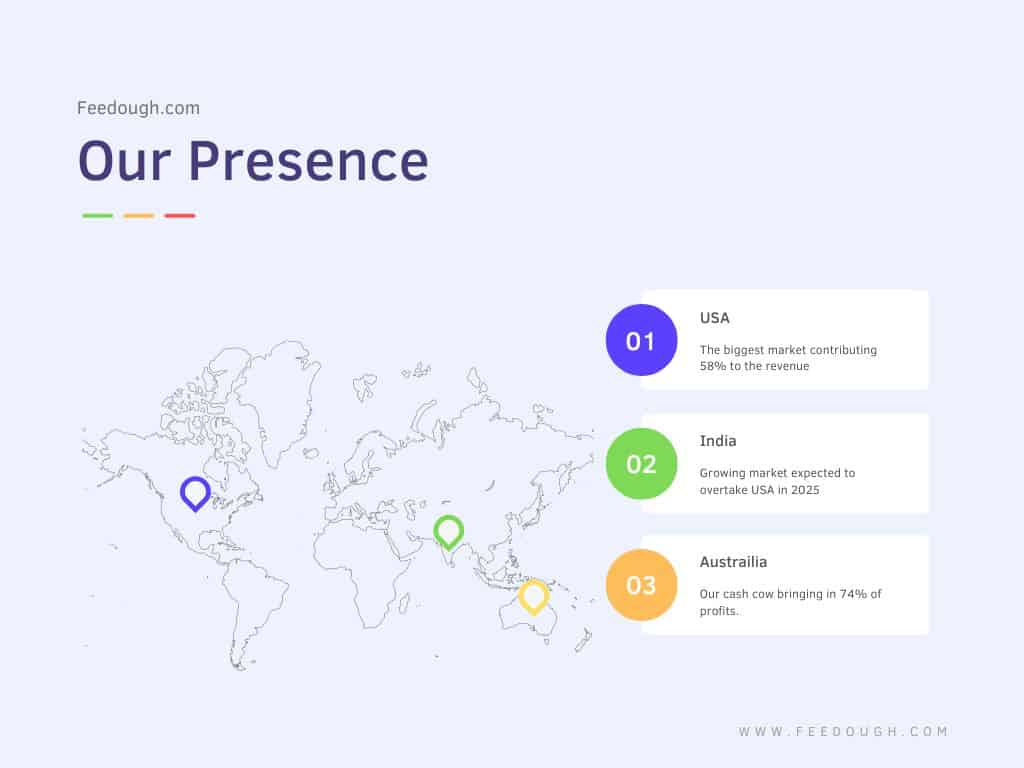
Maps And Geographical Data Infographic
Infographics are also used to create maps and visually represent geographical data.
This kind of infographic can be used to present changes in population, migration patterns or land use over time.
It could also be used to compare areas in terms of certain aspects such as income levels, educational attainment or quality of life.
Characteristics Of Infographics
Even though infographics come in all shapes and sizes, there are some common characteristics that make them effective.
These include:
A clear, concise and easy-to-understand structure,
Visual elements that make the data easier to comprehend,
Relevant and up-to-date information,
An engaging design that catches your attention,
Data points that are clearly labelled and organised.
Infographics are also tailored to the audience they’re intended for. This is important so that readers can easily understand the information being presented.
Steps To Creating An Infographic
Pairing images with short-form text is proven to become one of the most effective ways to communicate with the audience. However, creating an effective infographic isn’t as simple as just throwing together a bunch of facts, figures and images. Here is the typical process used to make an infographic:
Identify the audience: Identifying who will benefit from the visual information sets the tonality for the content and visuals that shall be used in the infographic.
Research the topic: An infographic without information is just a fancy image. Finding the right information from internal and external sources is imperative to creating a good infographic.
Make a plan and determine what information will be conveyed: Once the audience and information insights are in place, the designer creates an outline of how the information will be conveyed. This forms the spine of the infographic and decides the type of infographic to be used.
Choose a relevant infographic design platform: Different design platforms cater to different users based on their design experience level. For expert designers, Adobe Creative Suite works well, while for non-designers, template-oriented platforms like Canva and Visme provide drag-and-drop editors with thousands of templates to choose from.
Choose a design style, including colours and layouts: Once the designer zeros on the platform, they then move to choose the design layout including colours, visuals, images, and other visual elements and align them in a sensible format according to the outline.
Share the finished product: Once done, the designer or the marketer either shares the infographic on their website, social media handles or embeds it into the blog posts.
Go On, Tell Us What You Think!
Did we miss something? Come on! Tell us what you think about our article on what is an infographic in the comments section.
Ravpreet is an avid writer, prone to penning compelling content that hits the right chord. A startup enthusiast, Ravpreet has written content about startups for over three years and helped them succeed. You can also find her cooking, making singing videos, or walking on quiet streets in her free time.
Each week I share research backed AI oriented content in my newsletter.
There are AI ideas, AI trends, tutorials, and guides.
24k entrepreneurs read it. I'd love you to join.


")