[Reader Disclosure]Our content is reader-supported. This means we may earn a commission if you click on some of our links.
The startup world is changing at a rapid pace, with new businesses being launched almost every single day. To keep up with the race and truly succeed, you have got to be in the know about startups. And what better way there is to do that than by consulting crucial data and figures?
Let’s look at some of the most important startup statistics, startup trends, startup facts, and insights. We will discuss the failure rate of startups, the funding landscape, the most popular industries, and the challenges that startups face.
Global venture funding in Q2 2023 fell 18% quarter over quarter to $65 billion, which is down 49% compared to the second quarter of 2022, when startup investors spent $127 billion.
In H1 2023, global funding reached $144 billion, marking a 51% decline from the $293 billion invested in H1 2022 and a 10% decline from the second half of 2022.
Since Q3 2022, each quarter’s global funding total has dropped by more than 45% year over year.
Late-stage funding totalled $31 billion in Q2 2023 — the lowest quarter on record since 2018.
Early-stage funding reached $27 billion in Q2 2023 — down 45% from the $48 billion invested in Q2 2022. Deal counts decreased by 35%.
Seed-funded startups raised $6.8 billion in Q2 2023, down by 39% from the $11.2 billion invested in Q2 2022.
Companies registered as AI raised $25 billion in the first half of 2023, representing 18% of global funding.
OpenAI raised $10 billion in Q1 2023 led by microsoft.
Machine-learning startup Inflection AI raised $1.3 billion in Q1 2023.
Other AI companies that raised large funding in Q2 2023 include Anthropic, CoreWeave, OpenAI, Cohere, Builder.ai, and Runway.
Companies in sectors outside of AI that raised large funding in Q2 2023 include China-based fast fashion retailer Shein, Germany-based solar and smart electricity company 1Komma5°, and Sweden-based battery manufacturer Northvolt.
The first ever Decacorn was Facebook (now Meta), which achieved this status in the year 2007, crossing 10$ billion after a 240$ million dollar investment from Microsoft.
How Many Decacorns Are There In The World?
As of January 2023, 56 companies in the world have achieved Decacorn status.
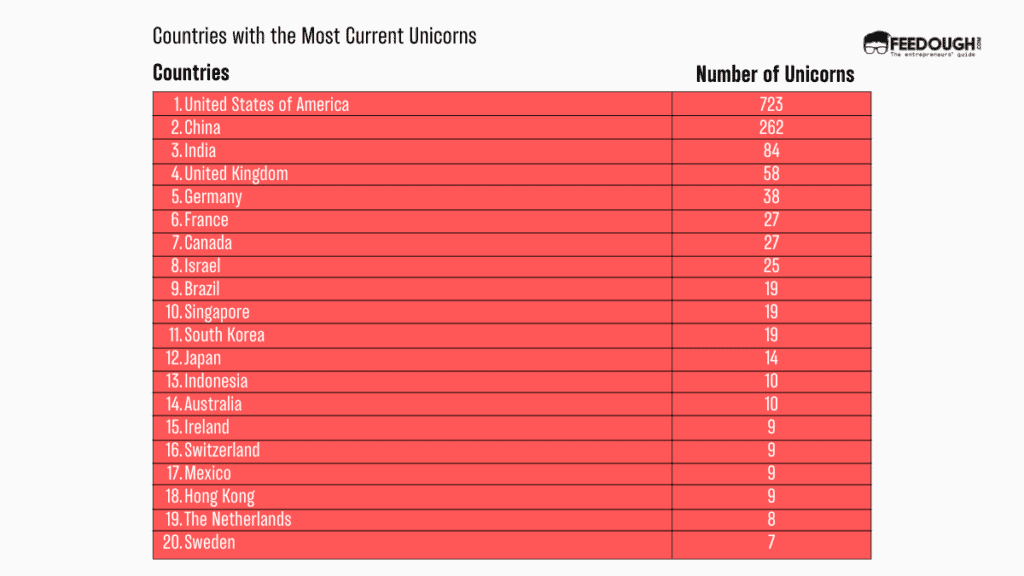
Which Country Has The Most Decacorns?
The United States is the largest contributor, with 11 Decacorns, followed by China with 6 Decacorns.
Startup Employee Statistics
It takes an average of 6 months to hire someone for a startup.
Most startup employees put in 50-60 hours weekly, whereas many founders put in 60-100 weekly.
According to Payscale, the average salary of a startup employee is $106K/year.
In Q1 2023, fintech has been the most invested industry behind enterprise software (driven by OpenAI and the rest of generative AI), with over $14B in funding. This is, however, a 60% drop from Q1 2022, slightly more than 51% of the overall market.
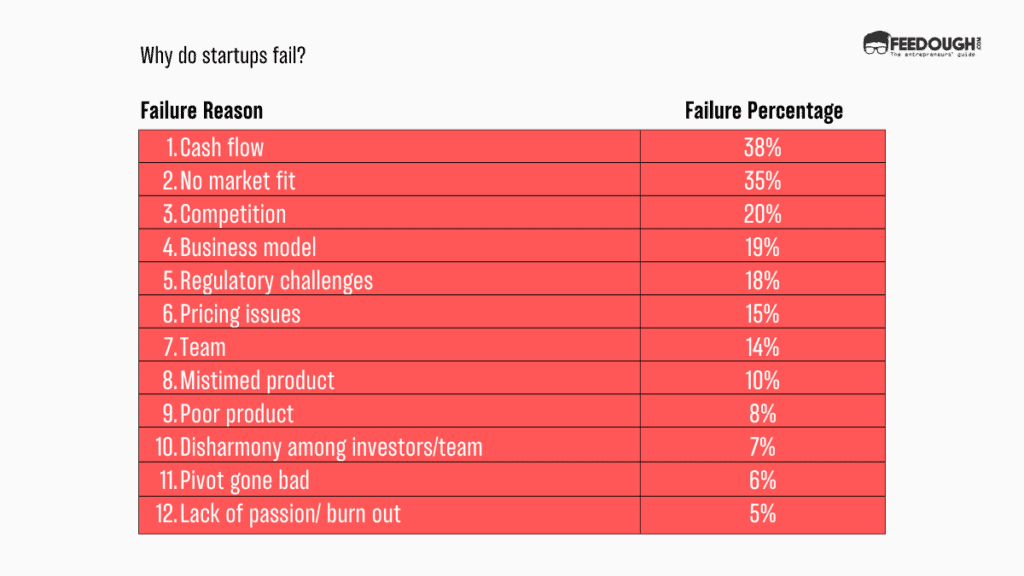
60% of new ventures fail due to issues with the team.
66% of European startups stated their company’s main funding source is self-financing. In contrast, only 9% were funded through business angels and 7% from venture capital and other companies.
In 2022, annual funding insurtech startups fell 53% from $17.8B to $8.4B, while deals fell 17% from 697 to 579.
In the first six months of 2023, U.S. digital health startups raised $6.1B across 244 deals, with an average deal size of $24.8M.
In the year 2023, till June 2023, Food Tech has raised $1.75B in equity funding across 195 rounds. In the same period last year (i.e. till June 2022), Food Tech companies had raised $5.66B across 330 rounds. So, 2023 has seen a 69.06% drop in funding in Food Tech companies as compared to 2022.
In 2021, 61% of super startups globally were B2B-focused, and 39% were B2C-focused.
In Q3 2022, food tech startup investment reached $4.7 billion, down 65% year on year.
An ardent reader, full-time writer and a lover of all things purple. Riya is an entrepreneurial spirit, making her way in the start-up industry through her expressive writing. When not working, you can find her jamming to music, watching period films, eating sushi, or petting cats.
Each week I share research backed AI oriented content in my newsletter.
There are AI ideas, AI trends, tutorials, and guides.
24k entrepreneurs read it. I'd love you to join.