
Most executives still describe AI as a future workplace disruption. The data says it already arrived, and it is moving faster than most organizations expected.
AI in the workplace statistics from 2025 show that 88% of organizations now use AI tools in at least one business function. That figure stood below 50% just three years ago.
Here is what the numbers reveal about where AI is delivering real returns, which roles are shifting fastest, and what the productivity data actually proves.
Key AI in the Workplace Statistics
Adoption crossed a critical threshold in 2025: 88% of global organizations now use AI in at least one business function, nearly double the 55% reported just two years earlier. Here are the numbers that define where AI in the workplace stands today.
- 88% of global organizations use AI in at least one business function as of late 2025, up from 55% in 2023 (McKinsey State of AI 2025)
- 97 million new roles are projected globally by 2027, while approximately 85 million may be displaced, resulting in a net positive of 12 million jobs (World Economic Forum Future of Jobs Report 2025)
- 52% of U.S. workers now use AI in their role, up from 46% in Q4 2025 and continuing a rapid upward trend (Gallup Q2 2026)
- 16% of C-suite executives predict employees will use generative AI for over 30% of daily tasks within one year (McKinsey, Jun 2025)
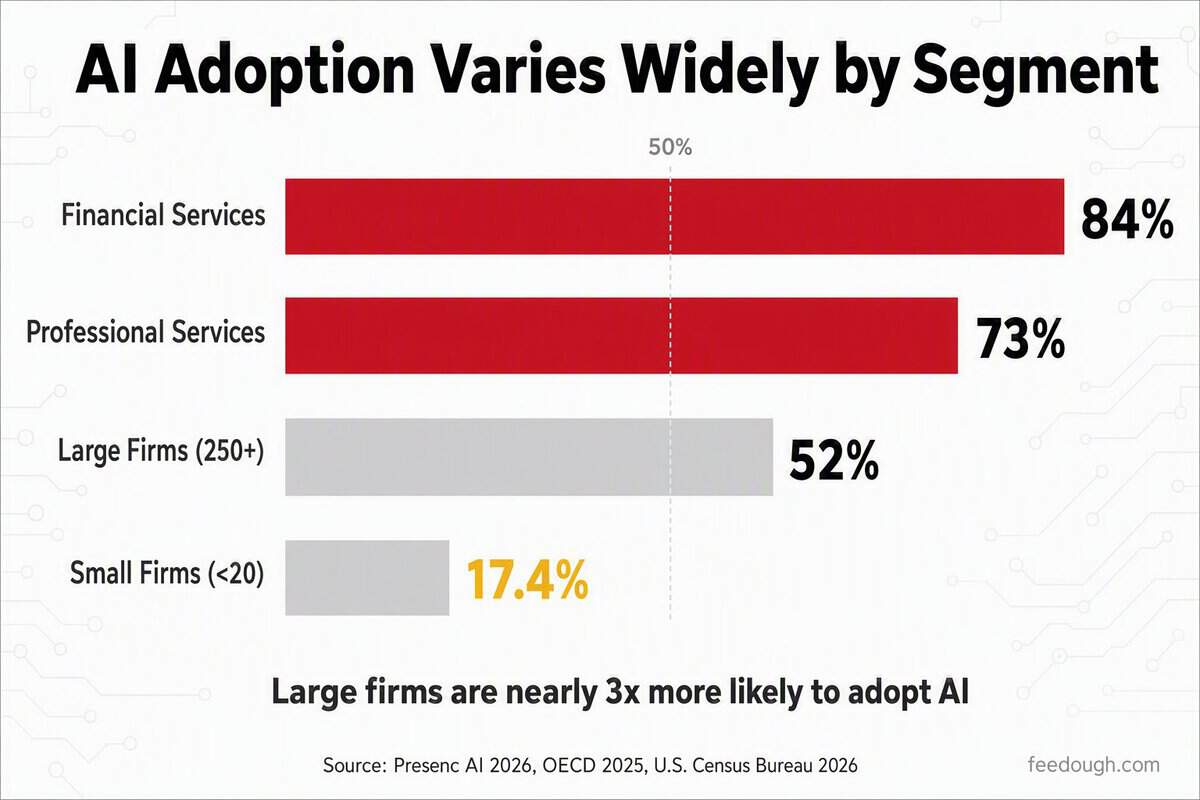
- 52% of large firms use AI compared to 17.4% of small firms, making large companies roughly three times as likely to adopt AI (Exploding Topics, 2025)
AI Adoption Statistics by Company Size and Industry
Large firms are nearly three times as likely to use AI as small ones. Financial services hit 84% adoption in 2026, up from 64% in 2024. Professional services followed the same trajectory, climbing from 48% to 73% over the same two-year span.
Segment | AI Adoption Rate | Source |
|---|---|---|
Financial services | 84% | Presenc AI, 2026 |
Professional services | 73% | Presenc AI, 2026 |
Large firms (250+ employees) | 52% | OECD, 2025 |
Small firms (fewer than 20 employees) | 17.4% | OECD, 2025 |
These AI adoption statistics by company size tell a consistent story. The U.S. Census Bureau found 37% of large firms using AI in a recent two-week window. For firms with fewer than 20 employees, the figure was under 20%. Large firms move first, but falling costs and maturing tools are bringing smaller ones along.
AI Adoption by Industry Statistics in 2026
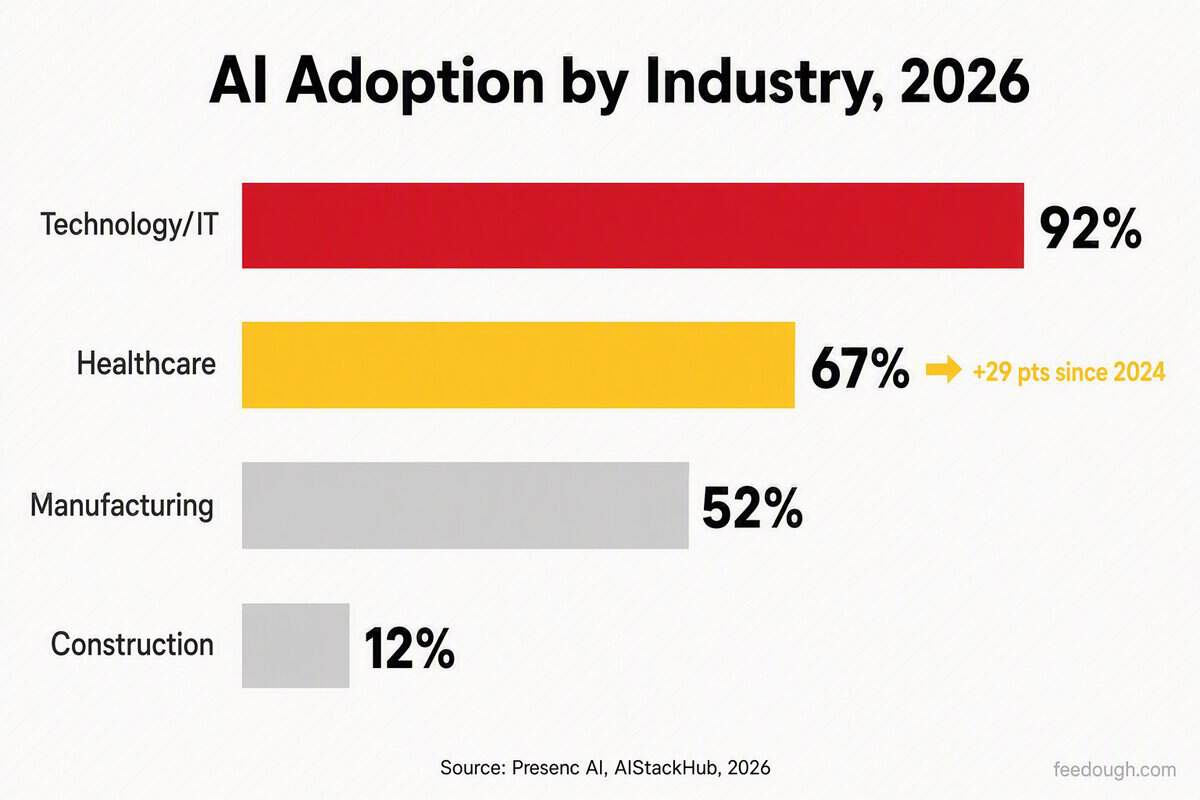
Healthcare AI adoption jumped 29 percentage points between 2024 and 2026, from 38% to 67%, outpacing every other sector. The FDA cleared 178 AI-powered medical devices in 2025, creating the regulatory pathway that unlocked clinical deployment at scale.
Industry | 2026 Adoption Rate | Context |
|---|---|---|
Technology/IT | 92% | Up from 78% in 2024 |
Healthcare | 67% | Up from 38% in 2024 |
Manufacturing | 52% | Predictive maintenance and quality control |
Construction | 12% | Up from 1.5% in 2025 |
The financial impact of these adoption rates is already visible across sectors:
- Healthcare delivers $3.20 in ROI for every $1 invested, with typical returns appearing within 14 months
- Financial services firms spend $3,200 per employee on AI, 2.6 times the cross-industry average
- Global enterprise AI spending reached $186 billion in 2026, up 47% from $126.5 billion the prior year
The gap between AI leaders and laggards within each sector averages 3.8x in revenue growth. That differential explains why even slow-adopting industries like construction are now accelerating: competitive pressure has made inaction measurable.
Employee AI Usage Statistics by Profession and Generation
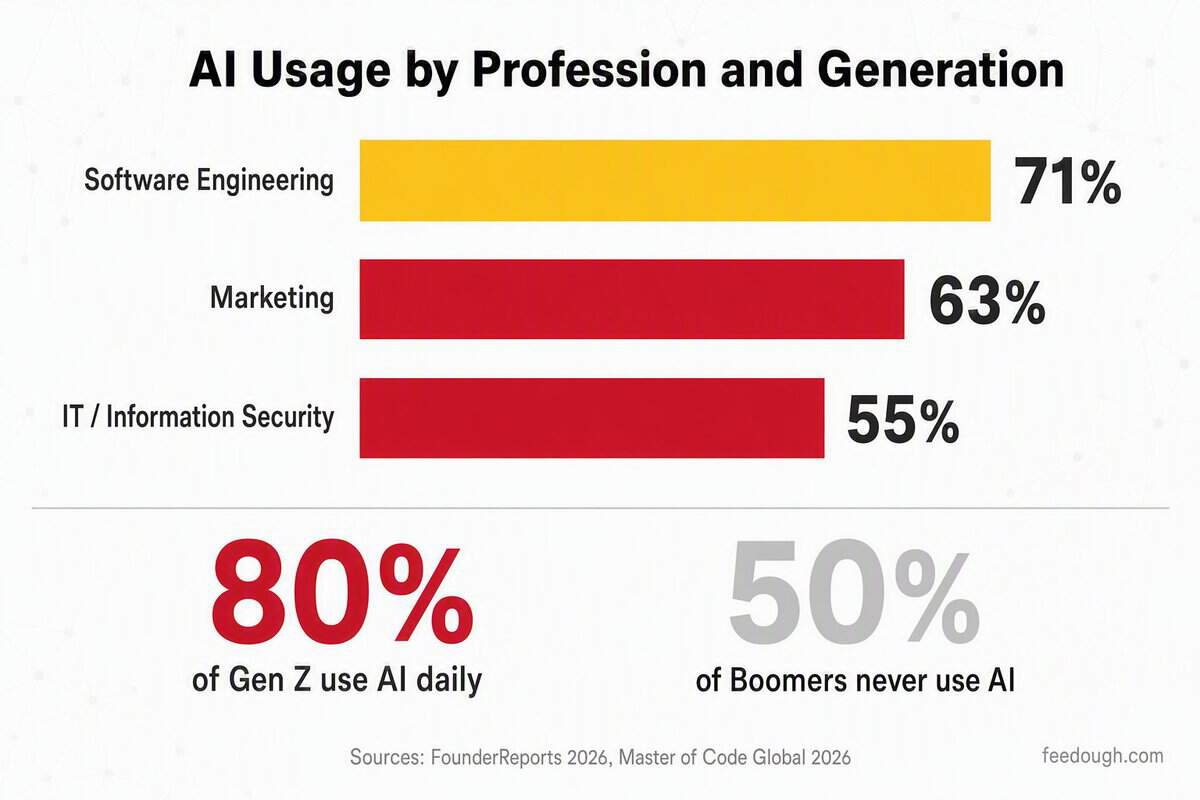
Software engineers lead all professions at 71% daily AI usage. Half of all Boomers never use AI at work at all. The divide is not a smooth gradient. It is structural, and the most common tasks driving adoption are narrower than most people assume.
Gallup’s Q2 2026 workforce study found the applications clustering around a handful of practical functions:
- 51% of AI users at work use it for writing and editing
- 49% use AI for search or research
- 39% use it for general assistance or problem solving
- 31% use it for knowledge or information management
- 29% use it for email or communication management
Those tasks concentrate in knowledge-intensive roles. FounderReports’ 2026 workplace survey shows daily AI usage breaks down sharply by profession:
Profession | Daily AI Usage |
|---|---|
Software Engineering | 71% |
Marketing | 63% |
IT/Information Security | 55% |
The generational pattern is equally stark. Master of Code Global’s July 2026 analysis found that 80% of Gen Z professionals use AI for more than half their daily duties. Half of all Boomers do not use AI at work at all.
SHRM’s 2026 survey of 5,875 U.S. workers measured the productivity tradeoff. The average AI user saves about six hours per week, but spends roughly four correcting AI output. Directors and above reclaim nine hours; individual contributors save four.
AI Productivity by Job Function Statistics
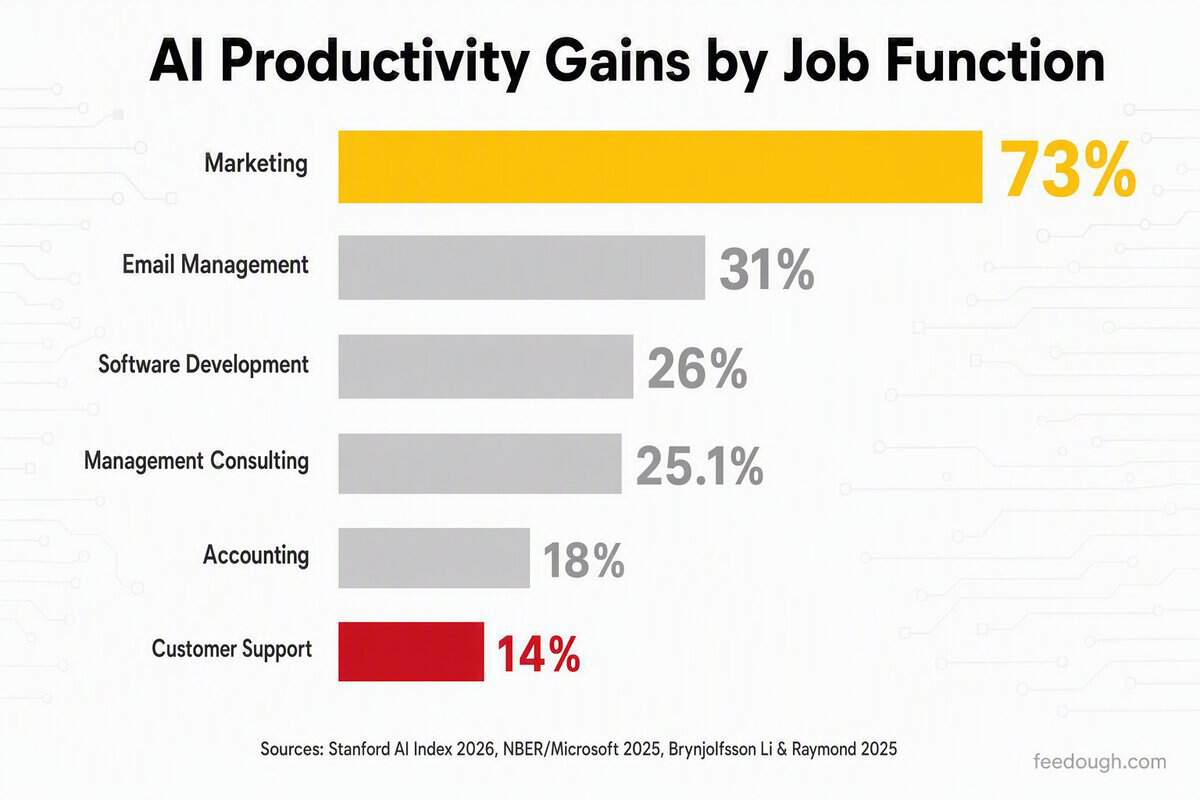
Marketing teams using AI report 73% productivity gains. Customer support teams using the same technology report 14%. The gap between those two numbers reveals more about how AI actually works at work than any single adoption headline.
Function | Productivity Gain | Source |
|---|---|---|
Marketing | 73% output increase | Stanford AI Index 2026 |
Email management | 31% time reduction | NBER/Microsoft, 2025 |
Software development | 26% efficiency gain | Stanford AI Index 2026 |
Management consulting | 25.1% faster completion | 2025 field experiment |
Accounting | 18% capacity increase | 2025 study (277 accountants) |
Customer support | 14% issues resolved per hour | Stanford AI Index 2026 |
Stanford’s AI Index 2026 aggregates results across multiple field experiments and company deployments. The customer support numbers add a layer the headline figure misses: the Brynjolfsson, Li and Raymond study measured a 14% average increase in issues resolved per hour, but novice workers saw 34% improvement. AI compresses the learning curve more than it accelerates experienced performers.
A preregistered experiment with 758 management consultants found that AI lifted output quality by 40% alongside the speed gain. Performance dropped 19 percentage points, though, on tasks that fell outside AI’s design zone. The pattern holds across every function in the table: AI excels at the pattern-heavy, lower-judgment portions of each role, and the gains stop where human expertise has to lead.
AI Job Impact Statistics: Job Creation vs. Displacement in 2025
Goldman Sachs Research estimates that just 2.5% of U.S. employment faces displacement from AI’s current use cases. Brookings counted 6.1 million American workers who combine high AI exposure with almost no ability to adapt. Both numbers are accurate. That contradiction defines the real shape of AI’s impact on jobs.
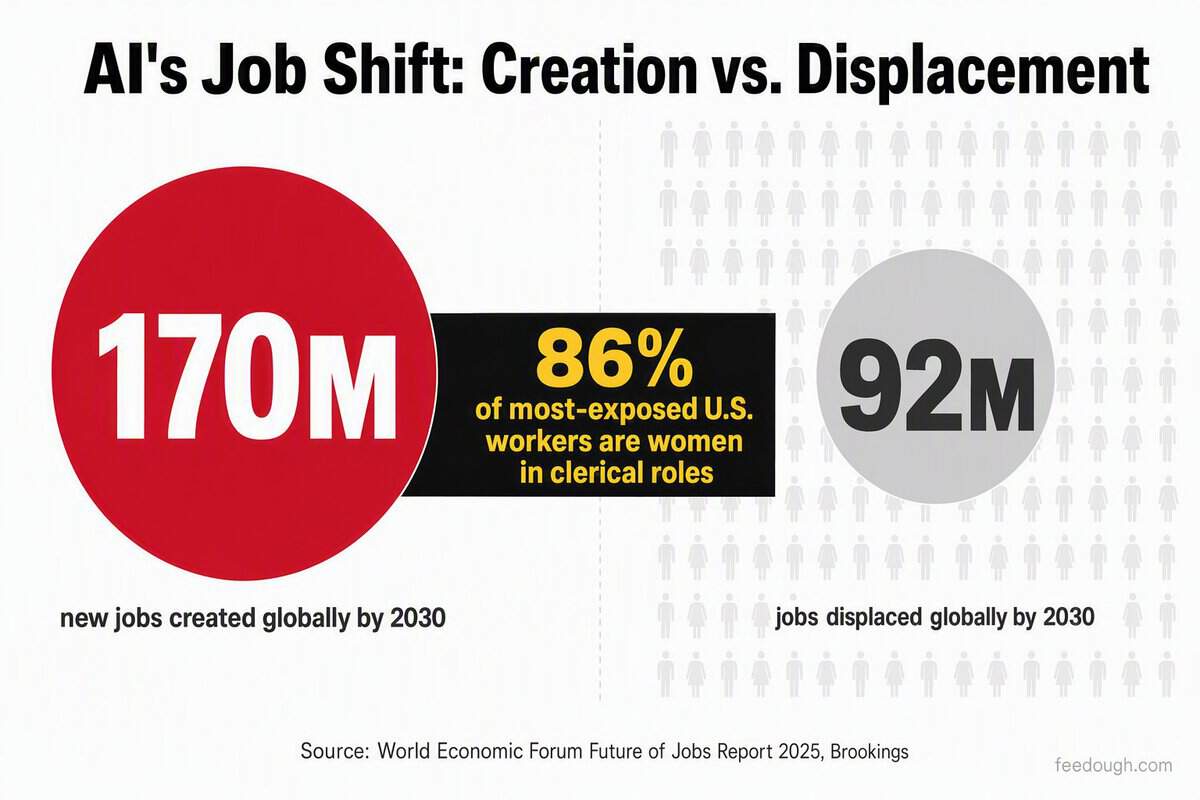
The World Economic Forum projects 170 million new jobs created and 92 million displaced globally by 2030. The earlier 2025 forecast had already projected 97 million created against 85 million lost, and the trajectory has only accelerated. The workers most exposed to displacement and the roles being created occupy almost entirely different populations. The breakdown by specific role makes the divide visible:
Role Category | Impact | Key Figure |
|---|---|---|
Procurement clerks | Displacement risk | 95% chance of reduction |
Production planning clerks | Displacement risk | 85% chance of reduction |
Admin/clerical (aggregate) | Displacement risk | Near 100% automation potential |
AI Engineer | Job creation | +143.2% year-over-year |
Prompt Engineer | Job creation | +135.8% year-over-year |
AI Content Creator | Job creation | +134.5% year-over-year |
Entry-level hiring at the 15 largest tech companies fell 25% from 2023 to 2024. Workers aged 22 to 25 in AI-exposed occupations saw a 13% employment decline through mid-2025, according to Stanford Digital Economy Lab. The roles being created demand technical skills that entry-level workers have not yet had time to develop.
The distributional reality is stark. 86% of the 6.1 million most-exposed U.S. workers are women, concentrated in clerical and administrative roles facing the steepest automation risk. The 640,000 AI-related positions created in the U.S. since 2023 require specialization that most displaced workers do not carry. Net positive is not the same as evenly distributed.
AI Business Cost and ROI Statistics
Companies plan to spend 1.7% of revenue on AI in 2026, doubling the prior year’s allocation. But 42% of AI projects were scrapped in 2025, up from 17% the year before. Buying AI and profiting from AI remain two very different exercises.
Metric | Value | Source |
|---|---|---|
Average GenAI return | $3.70 per dollar spent | IDC/Microsoft, 2025 |
Mature AI program return | $4.60 per dollar spent | Accenture |
Pilot-phase AI return | $1.20 per dollar spent | IDC/Microsoft, 2025 |
AI projects scrapped in 2025 | 42% | Dan Cumberland Labs |
CEOs reporting no significant financial benefit | 56% | PwC, 2026 |
Organizations attributing any EBIT impact to AI | 39% | McKinsey |
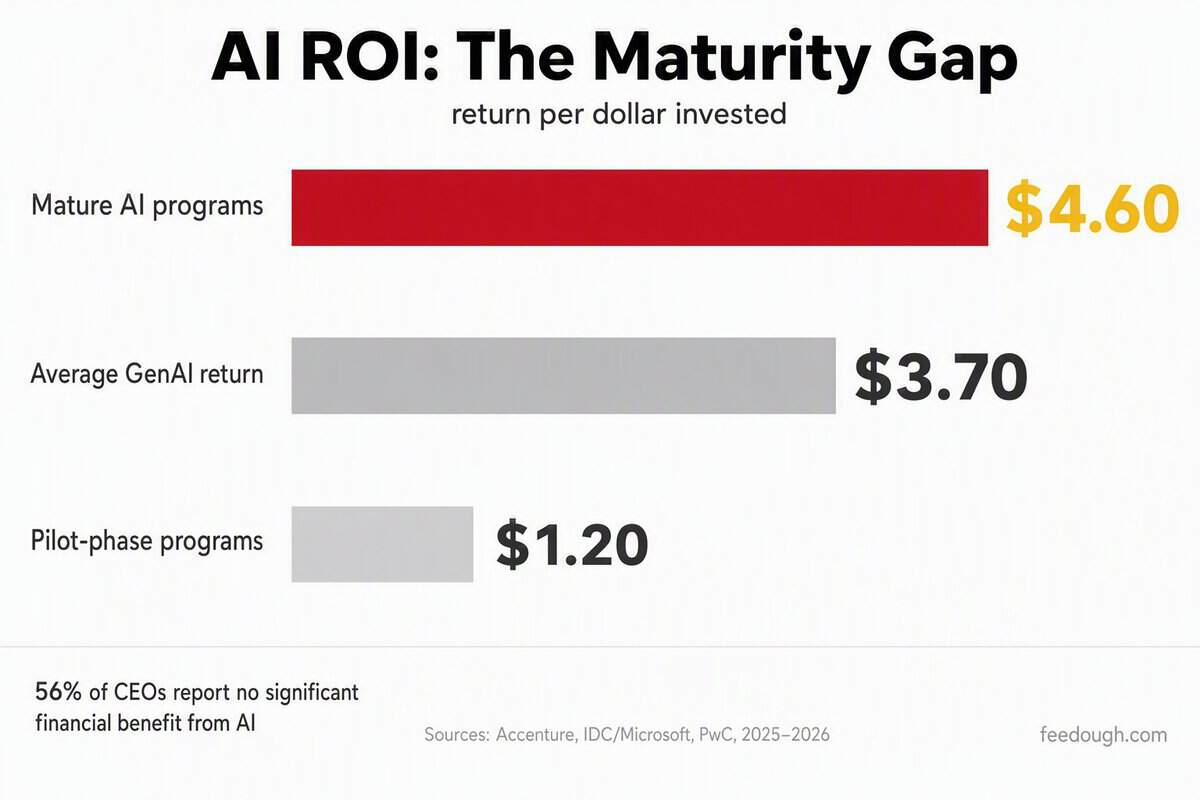
PwC’s 2026 survey of 4,454 CEOs found 56% report no significant financial benefit, yet Wharton shows 74% see positive GenAI ROI. AI agents cost $0.25 to $0.50 per interaction versus $3.00 to $6.00 for human agents. The cost advantage is not the problem. The gap between a $4.60 return and a $1.20 return is about workflow design, not budget.
Healthcare AI Adoption by Application Statistics
In healthcare AI adoption, radiology holds 76% of all FDA-authorized medical devices. It is the most regulated, most validated, and most deployed clinical AI domain in the country. But it is not the fastest-growing.
Healthcare AI Application | Hospital Deployment Rate | Key Detail |
|---|---|---|
Radiology/Imaging AI | 90% of US health systems | 1,104 of 1,451 FDA devices; 40% fully deployed across all facilities |
Sepsis Prediction AI | 67% of US health systems | 70-85% accuracy in early detection |
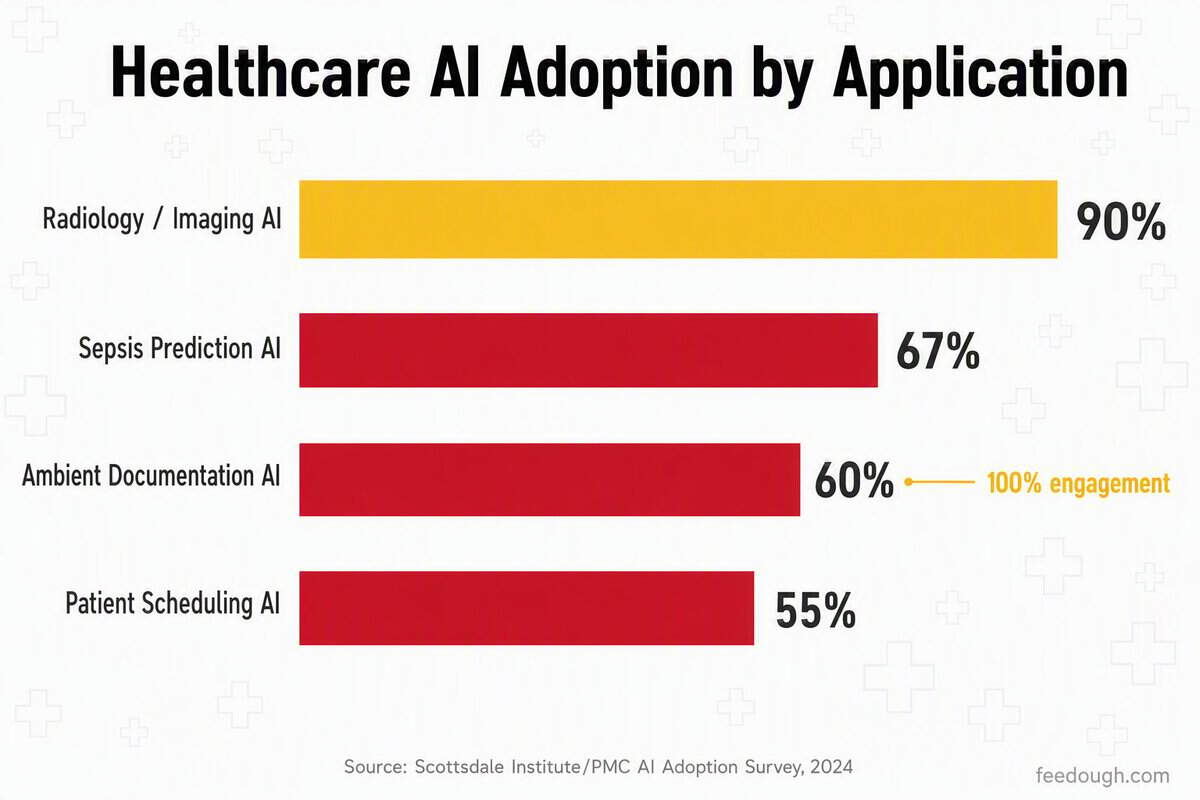
Ambient Documentation AI | 60% deployed; 40% piloting | Only use case with 100% organizational engagement |
Patient Scheduling / Waitlist | 55% fully embedded | Administrative AI captures 60% of total healthcare AI spend |
The clinical evidence behind these deployment tiers varies sharply. Radiology has the deepest trial data:
- Mammography screening AI detected 29% more cancers (6.4 vs. 5.0 per 1,000 women) in the MASAI randomized trial of 105,934 participants, with sensitivity of 80.5% versus 73.8% for standard double reading and no increase in false positives
- Partially autonomous AI triage cut radiologist workload by 63.6% while increasing cancer detection from 6.3 to 7.3 per 1,000 in the AITIC paired trial
- Sepsis prediction AI reduced mortality by 30% and cut average hospital stays by two days across deployed health systems
- AI-powered medication management reduced adverse drug events by 40%
Ambient documentation AI is the only clinical application with 100% organizational engagement across surveyed US health systems. The ambient AI scribe market reached $600 million in 2025, growing 2.4x year-over-year, with more than 150,000 clinicians using these tools daily. Documentation AI does not require the same FDA clearance pathway as diagnostic devices. That regulatory difference partly explains why ambient documentation achieved universal engagement before radiology AI reached full deployment at even half of health systems.
AI in Finance Statistics 2026: Fraud Detection, Trading, and Risk Management
JPMorgan reports 98% fraud detection accuracy using AI systems, up from the 85-90% ceiling that legacy rule-based approaches never broke through. That single improvement explains why financial services became the first industry to deploy AI at enterprise scale across fraud, trading, and risk management simultaneously.
The global AI in fraud management market hit $14.7 billion in 2025 and is on track to reach $95.1 billion by 2036, growing at 18.5% annually. AI in finance statistics from 2026 point to the driver behind that expansion: AI-enabled fraud including deepfake and synthetic attacks surged 1,210% last year, while cyber-enabled scams reached $14.3 billion over the same period.
Metric | Value | Source |
|---|---|---|
AI fraud detection accuracy (JPMorgan) | 98% | KPMG, 2026 |
Financial institutions using AI for fraud | 90% | Feedzai, 2025 |
Institutions reporting ~40% fraud loss reduction | 72% | KPMG, 2026 |
US equity trades executed by AI algorithms | 70-80% | KPMG/AI Business Weekly, 2026 |
Investment firms using AI for algorithmic trading | 82% | KPMG, 2026 |
The defense side is scaling fast, but so is the offense. 90% of more than 500 financial crime professionals surveyed report an increase in AI-driven fraud attacks over the past two years. Overall fraud losses for banking institutions are projected to rise from $23 billion in 2025 to $58.3 billion by 2030, driven by a 153% increase in more sophisticated fraud types. The same pattern recognition that delivers 98% detection accuracy also arms the other side of the transaction.

AI in Retail Statistics: Inventory, Personalization, and Revenue Impact
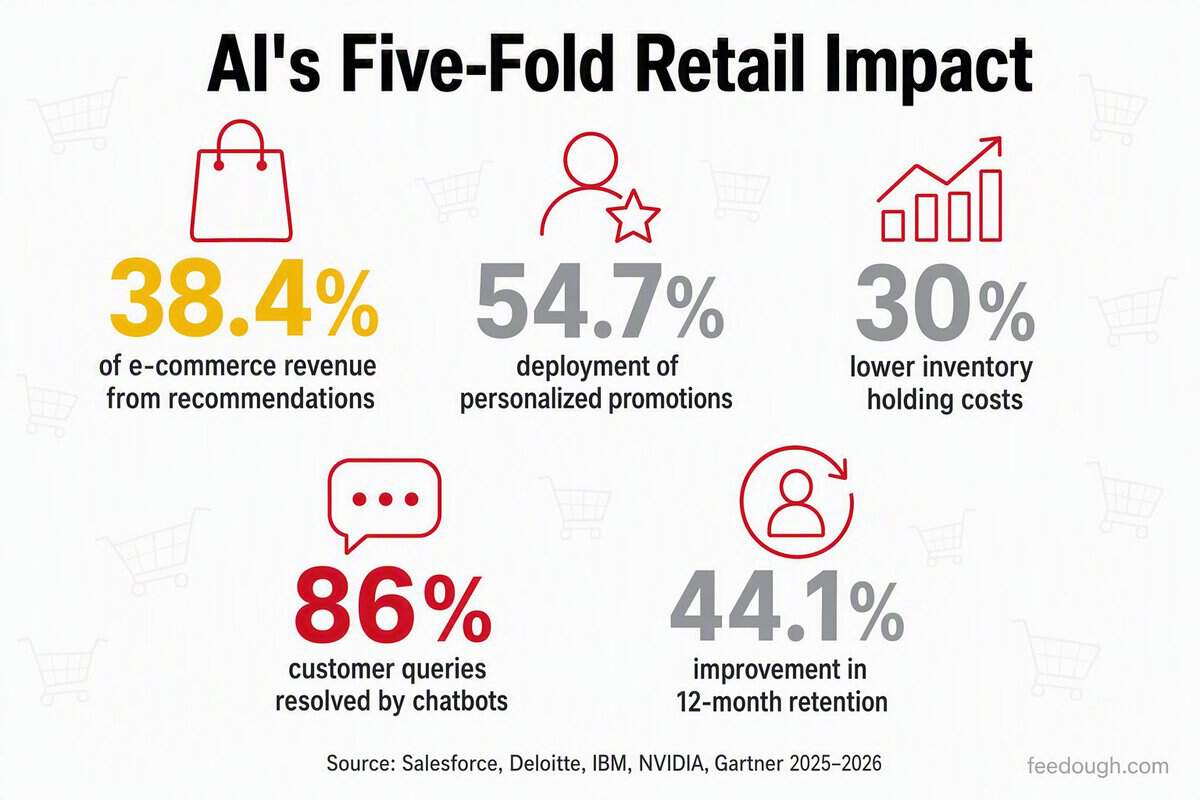
Retailers using AI across personalization, inventory, and customer service report 2.3x higher sales and 2.5x better profitability than non-adopters. NVIDIA’s 2026 retail survey found 89% of retailers now cite AI-driven revenue gains and 95% report cost reductions from the same deployments. The gap between those two numbers is the industry’s real dividing line: most retailers have deployed AI somewhere, but only a fraction have connected the systems that actually compound returns.
Retail AI Application | Key Metric | Source |
|---|---|---|
AI recommendation engines | 38.4% of e-commerce revenue (top 500 retailers) | Salesforce, 2025 |
Personalized promotion engines | 54.7% of top 1,000 global retailers deployed | Deloitte, 2026 |
AI demand forecasting | Up to 30% lower inventory holding costs | IBM/ASD, 2026 |
AI customer service chatbots | 86% of queries resolved without human input | NVIDIA, 2026 |
Adaptive AI personalization | 44.1% improvement in 12-month customer retention | Gartner, 2026 |
The revenue number that best captures AI’s retail impact is the recommendation engine. Salesforce’s benchmark of 1.2 billion shopper journeys across 54 countries found these engines now shape 63% of all product discovery sessions and generate 38.4% of total e-commerce revenue among the top 500 global retailers. Retailers that connected recommendation engines to inventory forecasting and customer service into a coordinated system are the ones pulling away from competitors running single-function deployments.
AI in Education Statistics: K-12 and Higher Ed Adoption
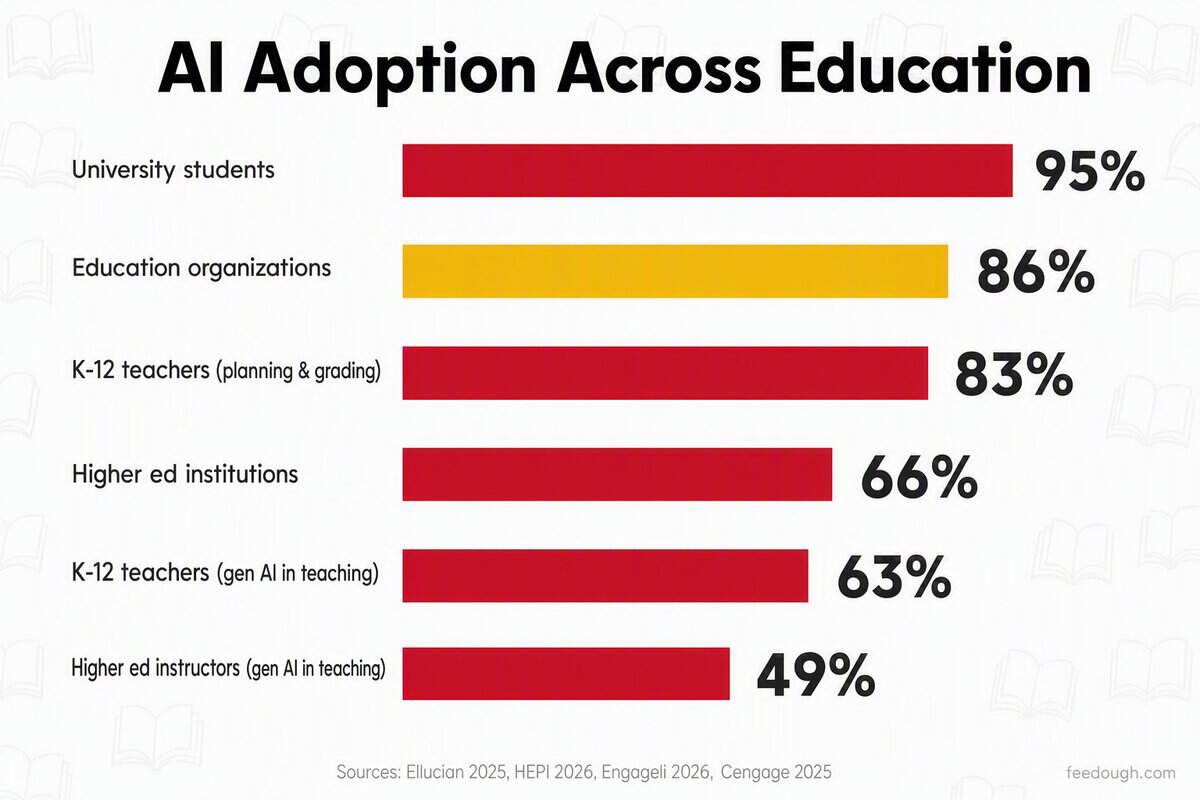
Education leads every other industry in generative AI adoption. 86% of education organizations now use generative AI, the highest rate across all sectors surveyed. K-12 teachers are integrating it faster: 63% have incorporated generative AI into their teaching, versus 49% of higher education instructors. The gap reflects different institutional constraints, not different appetites.
Education Segment | AI Adoption Rate | Source |
|---|---|---|
Education organizations (generative AI) | 86% | Ellucian, 2025 |
University students | 95% | HEPI Student Survey, 2026 |
K-12 teachers (planning and grading) | 83% | Engageli, 2026 |
Higher ed institutions (institution-wide) | 66% | Ellucian, 2025 |
K-12 teachers (gen AI in teaching) | 63% | Cengage, 2025 |
Higher ed instructors (gen AI in teaching) | 49% | Cengage, 2025 |
The segment most aggressive in adoption is also the youngest. HEPI’s 2026 Student Generative AI Survey found 95% of university students now use AI tools, up from 66% just two years earlier. K-12 schools account for 53% of all AI deployments in education globally, while higher education represents 39%. The common thread across both levels is time compression, and the measurable impact is already showing up in teacher workload data:
- Teachers using AI tools weekly save an average of 5.9 hours per week, equivalent to roughly six extra weeks per school year (Gallup, 2025)
- 59% of K-12 teachers report more personalized instruction since adopting AI tools (Engageli, 2026)
- In Latin America, 92% of university students and 79% of faculty are actively engaging with AI (Digital Education Council, 2026)
Morgan Stanley projects generative AI could add $200 billion in value to the global education sector by reducing administrative work and improving learning outcomes. The AI in education market is projected to grow from $9.58 billion in 2026 to $42.48 billion by 2030 (41.5% CAGR). North America holds 36% of the global market. Adoption created the demand; the spending is catching up.
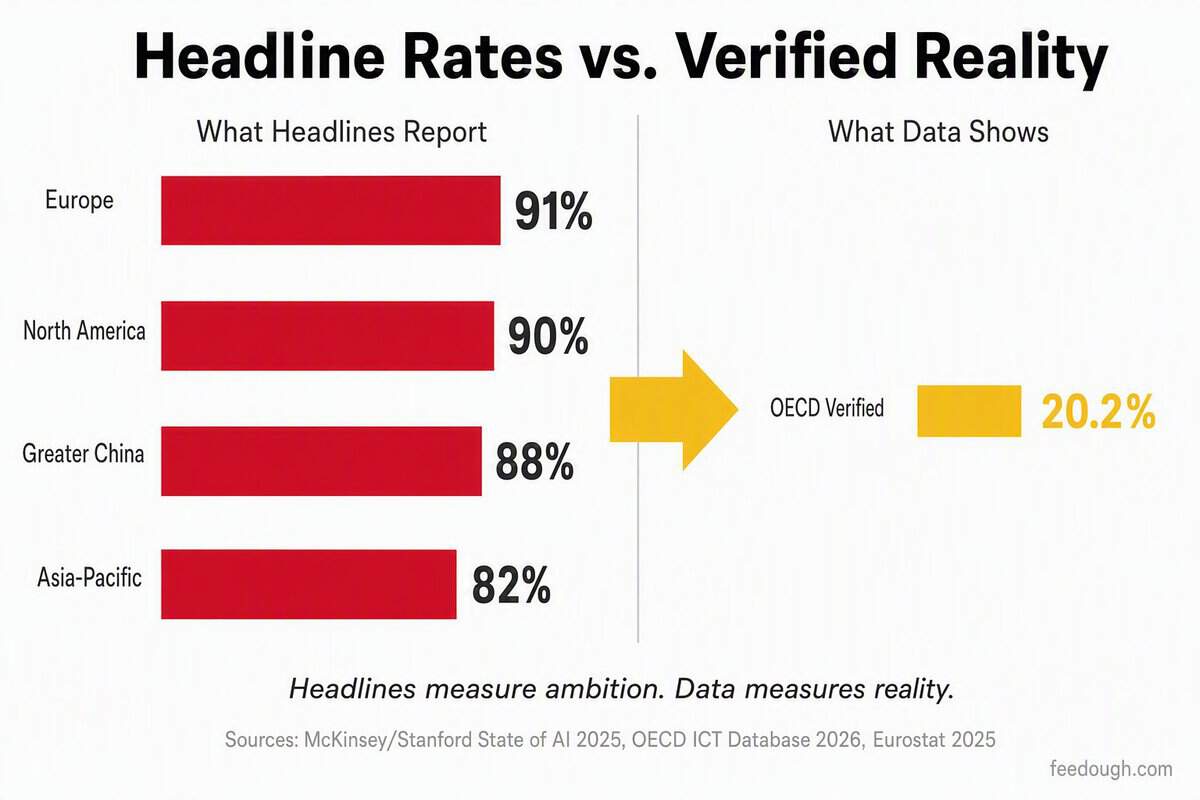
Europe leads the world in enterprise AI adoption at 91%, overtaking North America’s 90% in 2025. OECD firm-level data measured actual AI integration at 20.2% the same year. The distance between those two numbers defines every regional comparison in this section.
North America still dominates the global AI market at 36.92% and controls 41% of worldwide AI infrastructure spending. Asia-Pacific holds 31% of infrastructure and is on track to capture 47% of the global AI software market by 2030. Europe accounts for 20% of infrastructure despite leading on headline adoption, a disconnect that mirrors the gap between self-reported and verified deployment.
Region | Enterprise AI Adoption (2025) | Growth Since 2023 | Global AI Market or Infrastructure Position |
|---|---|---|---|
Europe | 91% | +34 pp | 20% of global AI infrastructure |
North America | 90% | +29 pp | 36.92% of AI market; 41% of infrastructure |
Greater China | 88% | +13 pp (single year) | Leads in patents, publications, robot installations |
Asia-Pacific | 82% | +24 pp | 31% of infrastructure; 47% of market by 2030 |
Executive surveys asking whether organizations “use AI” capture experimentation alongside full deployment. Eurostat counted just 19.95% of EU enterprises using at least one AI technology in 2025. The OECD’s firm-level average across member countries came in at 20.2%, though that figure more than doubled from 8.7% in 2023. Within the G7, AI usage in core business functions ranges from 1.9% in Japan to 6.1% in the United States. Headline rates measure ambition. Firm-level data measures reality.
Agentic AI Workplace Adoption Statistics and Scaling Challenges
Gartner forecasts that 40% of enterprise applications will embed task-specific AI agents by end-2026, up from under 5% in 2025. Employee-level adoption is keeping pace: daily AI use among U.S. workers rose from 4% to 15% in under three years. The demand side is moving faster than organizations can build the infrastructure to support it.
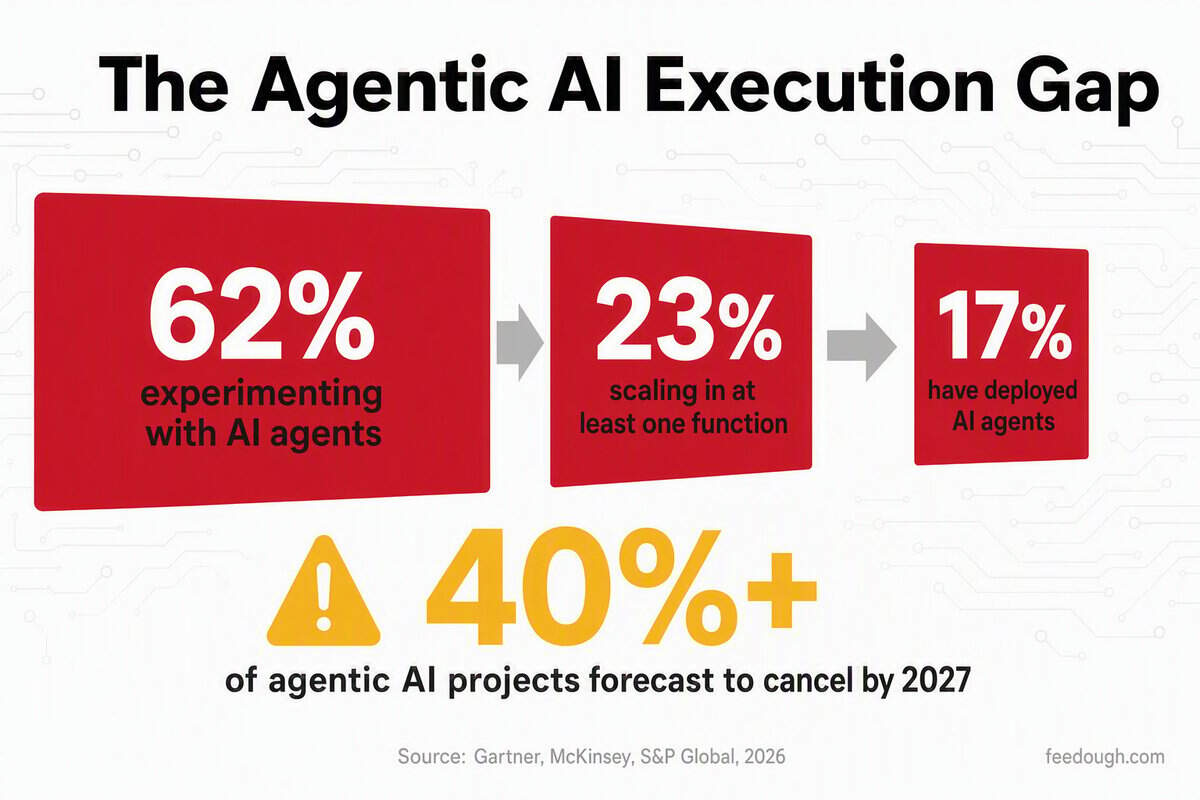
Deployment Metric | Value | Source |
|---|---|---|
Enterprise apps embedding AI agents (end-2026) | 40% (from under 5%) | Gartner |
Organizations experimenting with AI agents | 62% | Gartner / McKinsey / S&P |
Organizations at scale in at least one function | 23% | McKinsey / S&P |
Organizations that have deployed AI agents | 17% | Gartner Hype Cycle 2026 |
Agentic AI projects forecast to cancel by 2027 | 40%+ | Gartner / First Page Sage |
Customer service automation leads real-world agentic AI adoption at 64%, with 82% of interactions handled autonomously. Supply chain coordination follows at 58%, and IT monitoring at 53%.
Gartner and First Page Sage project over 40% of agentic AI projects will be canceled by 2027. Unclear business value and inadequate data quality are the primary causes. The interest is real. The execution gap is what matters now.
Sources
- https://www.itransition.com/ai/use-cases (2026-08-04)
- https://axis-intelligence.com/companies-using-ai-statistics (2025-11-05)
- https://careerbldr.com/blog/ai-job-market-impact-2026 (2025)
- https://www.gallup.com/workplace/712736/organizational-adoption-jumps-six-points.aspx (2026-05-20)
- https://www.census.gov/library/stories/2026/05/ai-use-businesses.html
- https://presenc.ai/research/ai-adoption-by-industry (2026-03-01)
- https://optinest.de/ai-infrastructure/adoption/sector-patterns/ai-adoption-by-industry-2026-statistics-and-benchmarks (2025-01-01)
- https://www.aistackhub.ai/ai-adoption-rate-by-industry (2026-06-01)
- https://aibusinessweekly.net/p/ai-productivity-statistics (2026-01-01)
- https://masterofcode.com/blog/generative-ai-statistics (2026-07-27)
- https://www.shrm.org/topics-tools/research/navigating-ai-in-the-workplace/full-report (2026-04-01)
- https://founderreports.com/ai-in-the-workplace-statistics (2026-01-01)
- https://www.elvex.com/blog/ai-tools-for-knowledge-workers (2026-01-01)
- https://toolfountain.com/ai-productivity-statistics (2025-01-01)
- https://www.makerstations.io/ai-adoption-at-work-statistics (2026-06-01)
- https://blog.saner.ai/ai-at-work-statistics (2026-01-01)
- https://laweconcenter.org/resources/ai-productivity-and-labor-markets-a-review-of-the-empirical-evidence (2025-01-01)
- https://masterofcode.com/blog/ai-in-customer-service-statistics (2026-01-01)
- https://novoresume.com/career-blog/ai-job-creation-statistics (2026-04-02)
- https://myxatalent.com/is-ai-replacing-back-office-jobs-in-2026 (2026-01-01)
- https://suplari.com/blog/10-procurement-job-roles-most-impacted-by-ai (2026-01-01)
- https://aibusinessweekly.net/p/ai-roi-statistics (2026-07-30)
- https://dancumberlandlabs.com/blog/ai-implementation-cost (2026-01-01)
- https://www.mavvrik.ai/blog/ai-cost-statistics-2026 (2026-01-01)
- https://iternal.ai/ai-implementation-cost (2025-10-01)
- https://www.getnextphone.com/blog/ai-customer-service-statistics (2026-01-01)
- https://thestacc.com/blog/ai-customer-service-cost-savings (2026-07-10)
- https://aihealthcare360.org/foundations/ai-healthcare-statistics (2026-08-20)
- https://theaidaily.nl/en/statistics/ai-in-healthcare-statistics-2026 (2026-06-14)
- https://www.frontiersin.org/journals/imaging/articles/10.3389/fimag.2026.1910013/full (2026-01-01)
- https://sqmagazine.co.uk/ai-in-healthcare-statistics (2026-06-09)
- https://aibusinessweekly.net/p/ai-in-finance-statistics (2026-01-01)
- https://www.futuremarketinsights.com/reports/ai-in-fraud-management-market (2025-01-01)
- https://verafin.com/2026/04/how-ai-is-reshaping-financial-crime-management (2026-04-23)
- https://www.bny.com/corporate/global/en/insights/ai-and-payments-fraud-an-evolving-landscape.html (2025-08-18)
- https://www.amraandelma.com/product-recommendation-engine-statistics (2026-05-18)
- https://www.allaboutai.com/resources/ai-statistics/ai-in-retail (2026-01-01)
- https://refact.co/insights/ecommerce/machine-learning-retail (2026-05-23)
- https://www.companieshistory.com/artificial-intelligence-in-retail-market (2026-01-01)
- https://www.charterglobal.com/ai-in-retail (2026-01-01)
- https://www.hepi.ac.uk/reports/student-generative-ai-survey-2026/ (2026-02-01)
- https://www.notieai.com/ai-in-education-statistics (2026-01-15)
- https://www.researchandmarkets.com/reports/5896034/ai-in-education-market-report (2026-04-01)
- https://www.precedenceresearch.com/ai-in-education-market (2026-02-25)
- https://www.demandsage.com/ai-in-education-statistics/ (2026-01-01)
- https://www.morganstanley.com/ideas/generative-ai-education-outlook (2025-01-01)
- https://www.grandviewresearch.com/industry-analysis/artificial-intelligence-ai-education-market-report (2026-01-01)
- https://news.gallup.com/poll/691967/three-teachers-weekly-saving-six-weeks-year.aspx (2025-06-01)
- https://www.digitaleducationcouncil.com/dec-insights/92-of-students-and-79-of-faculty-actively-engaging-with-ai-findings-from-ai-in-higher-education-latam-survey-2026 (2026-02-06)
- https://www.cengagegroup.com/news/press-releases/2025/ai-in-education-report-new-cengage-group-data-shows-growing-genai-adoption-in-k12–higher-education/ (2025-01-01)
- https://www.precedenceresearch.com/artificial-intelligence-market (2026-01-01)
- https://technologychecker.io/blog/ai-market-size-statistics (2026-01-01)
- https://ec.europa.eu/eurostat/statistics-explained/index.php?oldid=568530 (2025-01-23)
- https://www.oecd.org/en/about/news/announcements/2026/01/ai-use-by-individuals-surges-across-the-oecd-as-adoption-by-firms-continues-to-expand.html (2026-01-28)
- https://www.gtai.de/resource/blob/1933706/aa2bd686d091961f4c129a08b6da5ed5/20250930_FactSheet_AI_WEB.pdf (2025-09-30)
- https://www.manilatimes.net/2026/08/27/tmt-newswire/plentisoft/ai-infrastructure-market-new-insights-report-2026-top-two-players-hold-approximately-69-share/2413275 (2026-08-27)
- https://aurigait.com/blog/what-are-ai-agents-how-they-work-use-cases (2025-08-01)
- https://aibusinessweekly.net/p/ai-adoption-statistics (2026-01-01)
- https://firstpagesage.com/reports/agentic-ai-adoption-statistics (2026-07-24)