
Most companies are still debating whether AI agents justify a real budget line. The ones that stopped debating are already measuring returns they didn’t have six months ago.
AI agents statistics from 2026 show 96% of enterprises expanding their deployments this year, with early adopters reporting 6-10% revenue gains and cost reductions north of 37% in marketing operations alone.
Here is what the data reveals about who is pulling ahead, where the money is flowing, and which industries are furthest along.
Key AI Agents Statistics 2026
Enterprise adoption of AI agents is near-universal, but the gap between pilots and production tells the real story of where this technology actually stands.
- 96% of enterprises are expanding their use of AI agents in 2025
- 85% of organisations have integrated AI agents into at least one workflow
- 79% of employees report their companies are already using AI agents
- 78% of organisations now use AI in at least one function (up from 55% one year earlier)
- 51% of organisations are actively exploring AI agent integration
- Organizations using agentic prospecting see a 23% average revenue increase for sales teams, with $420K in annual revenue uplift per deployed customer-facing agent at the median
- 37% cost savings in marketing operations
- $2M in additional revenue generated from routing improvements alone (documented case)
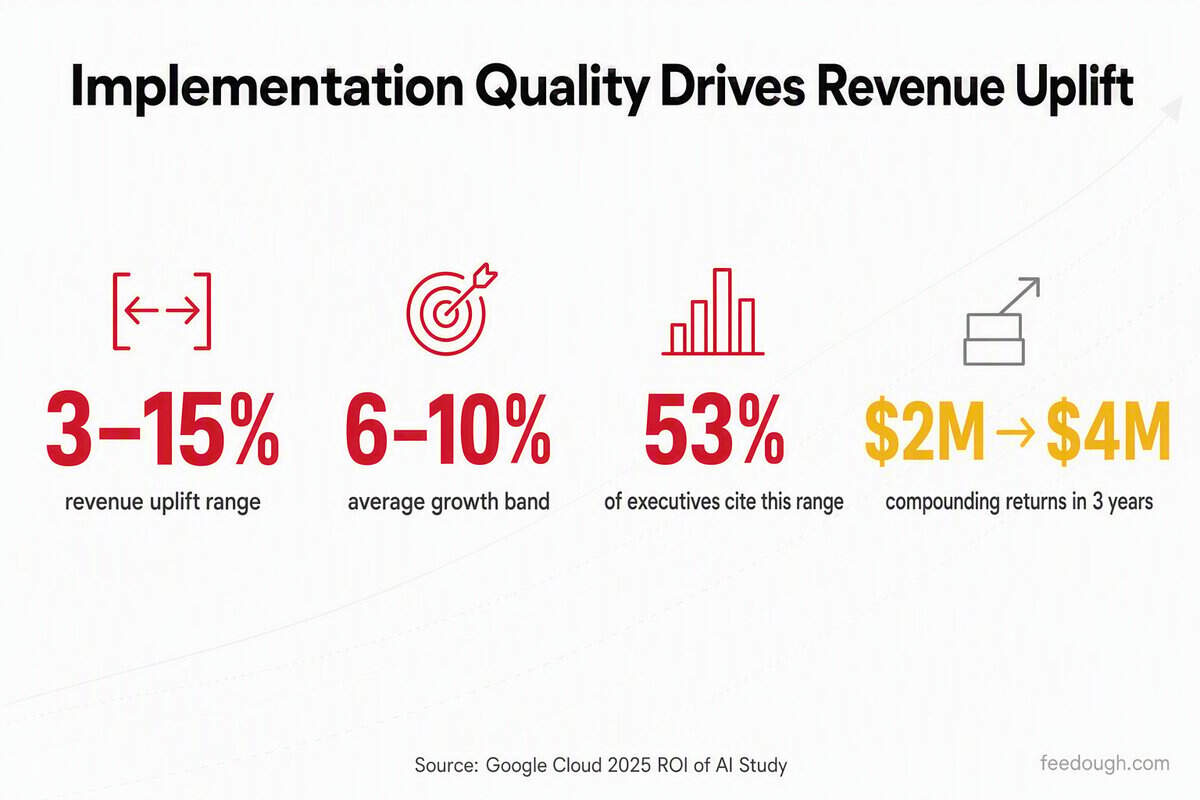
- 3–15% revenue uplift range, depending on implementation quality
- 14% productivity boost for customer support agents using generative AI assistants
- 13.8% more customer inquiries handled per hour with AI tools
- 120 seconds saved per customer contact on average
- 66% of companies using AI agents have reported measurable productivity gains
- 60% of customer inquiries are handled autonomously by AI agents in retail
- 75% of customer inquiries can now be fully resolved by AI tools without requiring human intervention across industries
- 45% of IT customer queries deflected away from human agents
- 31% of organizations have at least one AI agent in production, while 88% of AI agent pilots never reach production deployment
- 51% of enterprises use two or more methods to control and manage AI agent tools
- 42% of enterprises need access to eight or more data sources for successful deployment
- 53% of leadership teams cite security as their top challenge
- 65% of organizations experienced an AI-agent security incident with business impact in the past year, while only 14.4% have full security approval for all AI agents
- 76% of retail companies are increasing AI agent investment for customer service
- 15–50% of business tasks expected to be automated by AI agents by 2027
- AI agents market valued at $5.26 billion in 2024, estimated to reach $7.84 billion in 2025
- Projected to reach $48.3–$50.3 billion by 2030 across multiple research firms
- 46.3% compound annual growth rate (CAGR) through 2030
- Healthcare agentic AI market expected to grow from $0.71 billion in 2025 to $5.78 billion by 2031 at 42.03% CAGR
- $5.88 billion education AI agents market, projected $32.27 billion (31.2% CAGR)
- Enterprises with production AI agents achieve average ROI of 171% globally and 192% in the U.S., with median payback of 8.3 months
- 80% of IT workers have observed AI agents performing tasks without authorization, and 98% of organizations report shadow AI agent use
AI Agents Market Size and Growth Statistics 2026
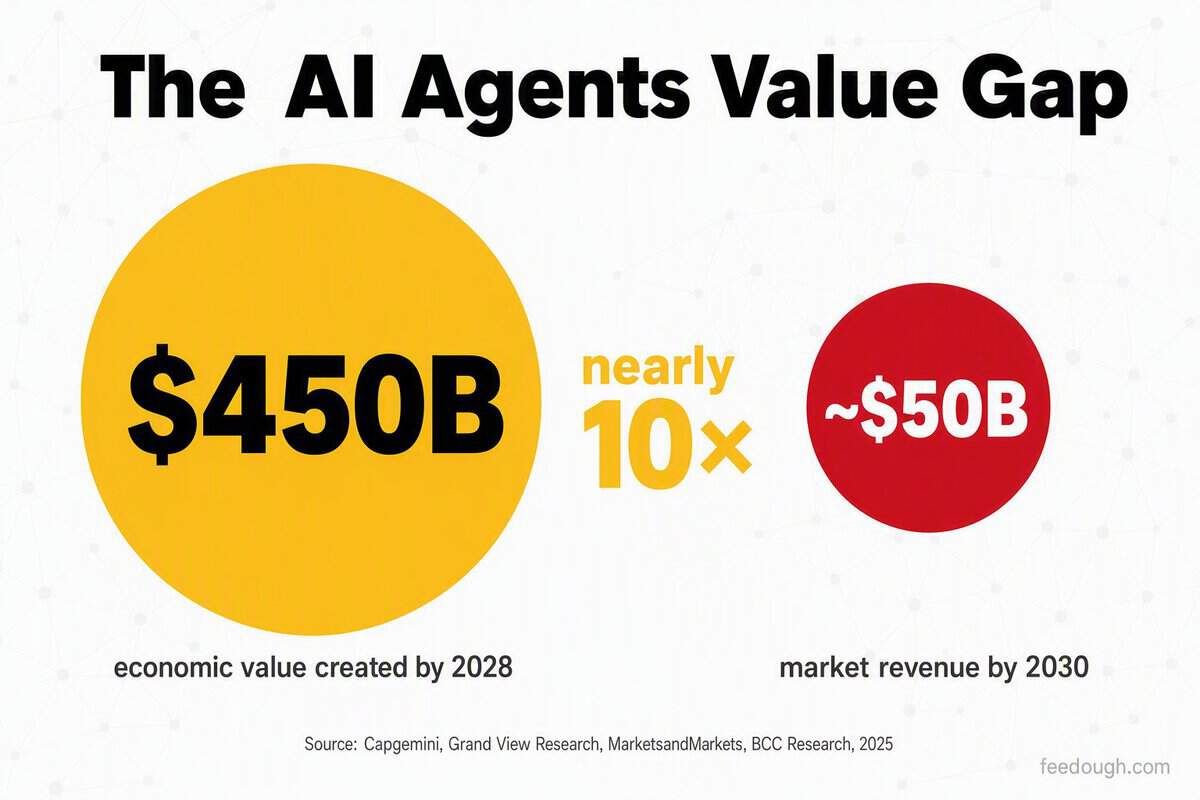
Capgemini projects AI agents could generate $450 billion in economic value by 2028. That figure dwarfs the market revenue projections every major research firm has published, and the gap is the point: what companies pay for AI agents is a fraction of the value those agents are expected to create.
Grand View Research, MarketsandMarkets, and BCC Research converge on a market reaching roughly $48–50 billion by 2030, with compound annual growth rates clustering between 41% and 46%. The consistency across independent methodologies makes this one of the most reliable growth forecasts in enterprise technology.
Market Segment | Current Value | 2030+ Projection | CAGR |
|---|---|---|---|
Overall AI agents market | $7.84B (2025) | $48.3–$50.3B (2030) | 45.8–46.3% |
Enterprise agentic AI | $2.58B (2024) | $24.50B (2030) | 46.2% |
Healthcare agentic AI | $0.71B (2025) | $5.78B (2031) | 42.03% |
Education AI agents | $5.88B (2024) | $32.27B (2030) | 31.2% |
North America captures 39.63% of global market revenue, but Asia Pacific is projected to grow fastest over the forecast period. Within the market itself, single-agent systems still hold 59.24% of the share, yet multi-agent systems (48.5% CAGR) and coding agents (52.4% CAGR) are expanding far more quickly. The industry-specific segment, growing at 62.7% CAGR, is the fastest of all. The market is not just scaling; it is fragmenting into specialized categories that will look nothing like today’s landscape.
Enterprise AI Agent Deployment, Security & Governance Statistics
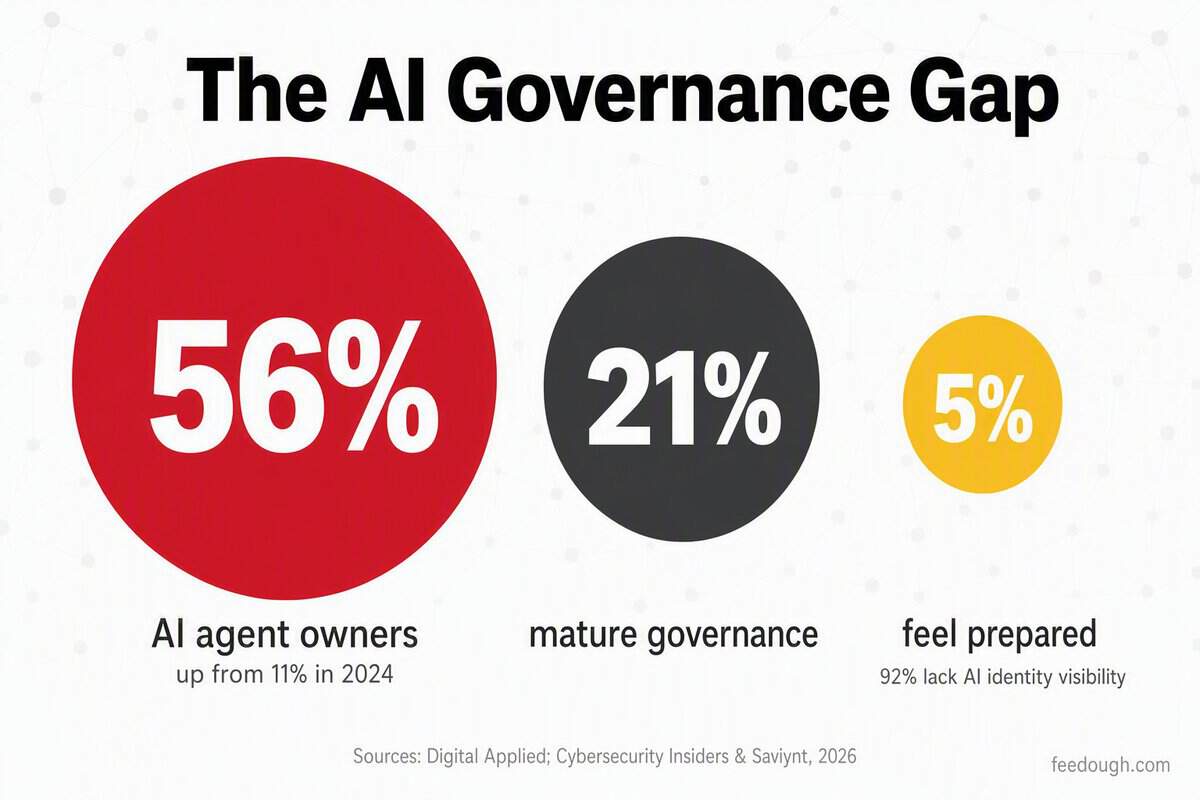
Enterprises created AI agent ownership roles four times faster than they built the governance to support them. By 2026, 56% of organizations named a dedicated AI agent owner or agentic ops lead, up from 11% in 2024. Only 21% have a mature governance model for autonomous agents.
Deployment Challenge | % of Enterprises | Source |
|---|---|---|
System integration barriers | 46% | Arcade.dev |
Data access & quality issues | 42% | Arcade.dev |
Security & compliance concerns | 40% | Arcade.dev |
Tech stack upgrades required before deployment | 86% | Tray.ai |
Mature governance model in place | 21% | Deloitte |
Cannot distinguish AI agent from human activity | 68% | Cloud Security Alliance |
The deployment challenges explain the slow rollout. The security visibility gap explains the risk. The 2026 CISO AI Risk Report by Cybersecurity Insiders and Saviynt found an industry-wide blind spot hiding inside most enterprise AI deployments:
- 92% of large-enterprise security leaders lack full visibility into their AI identities
- 86% do not enforce access policies for AI identities
- 71% say AI has access to core business systems like Salesforce and SAP, but only 16% govern that access effectively
- 63% of employees pasted sensitive company data including source code and customer records into personal chatbot accounts
- Only 5% feel prepared to contain a compromised AI agent
The financial exposure is no longer theoretical. 64% of companies with revenue above $1 billion reported losses exceeding $1 million from AI system failures during 2025. Over 40% of agentic AI projects face cancellation by 2027, not because the technology failed, but because the governance never caught up.
AI Agent ROI Statistics: Returns, Cost Savings & Payback Periods
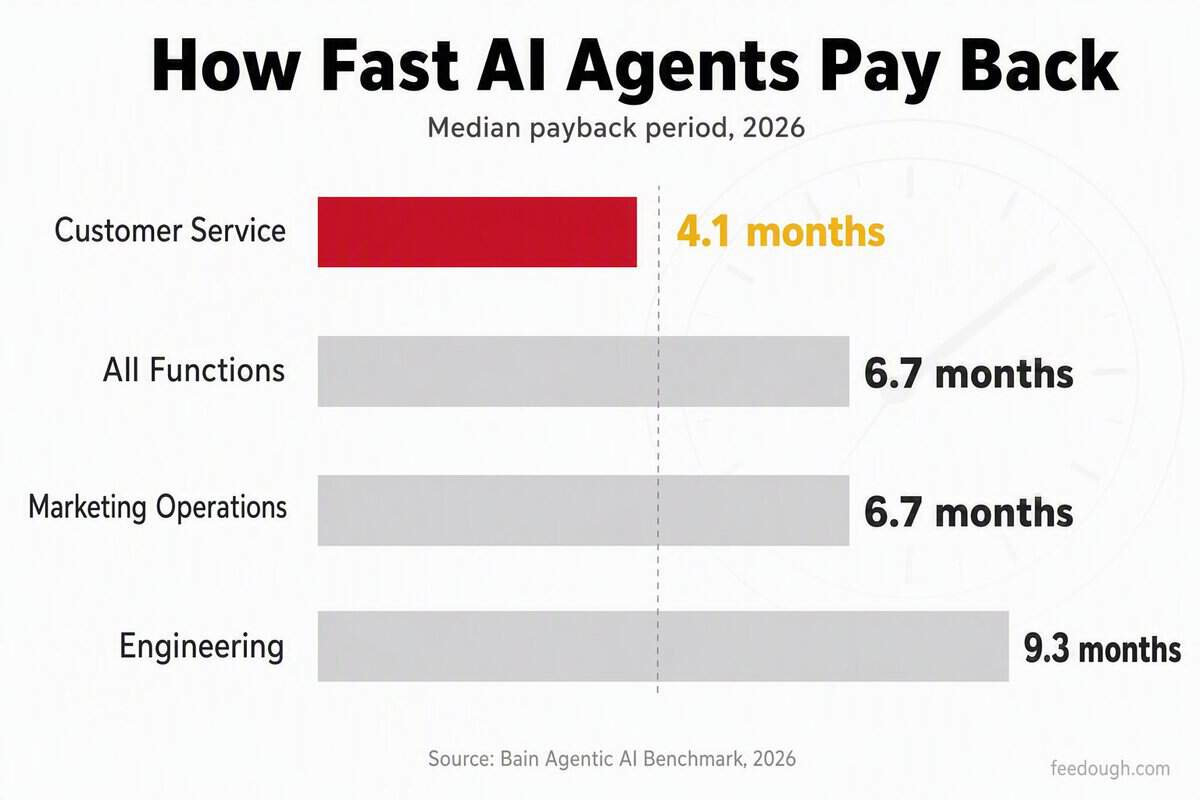
Bain’s 2026 Agentic AI Benchmark pegs the median payback at 6.7 months, down from 11.4 months the year before. But Gartner found only 41% of rollouts achieve positive ROI within 12 months, and 19% never reach payback. For deployers that get it right, the returns arrive fast:
- Businesses report $3.50 in return for every $1 spent on AI customer service agents, with top performers hitting 8x ROI
- Customer service cost per interaction drops from $6.00 to $0.50, a 12x efficiency gain
- Sales reps using AI are 3.7x more likely to hit quota, with 43% higher win rates
- Fortune 500 companies report median annual savings of $340,000 per deployed agent
Function | Median Payback |
|---|---|
All Functions | 6.7 months |
Customer Service | 4.1 months |
Marketing Operations | 6.7 months |
Engineering | 9.3 months |
Customer service leads because the math works. AI response cuts customer turnover by 15%, and customers are 2.4x more likely to stay loyal when issues resolve quickly. Yet 60% of all organizations see minimal value from their AI investments. The split is not about the technology. It is about choosing a function where the economics already favor automation, then executing on it.
AI Agents Revenue Growth Statistics: The Implementation Quality Factor
A 6% revenue increase on a $100 million business is $6 million. That baseline sounds straightforward, but the spread reveals the real variable. Agentic AI adopters report revenue gains ranging from 3% to 15%, and implementation quality explains almost the entire range.
Revenue Metric | Value | Context |
|---|---|---|
Average revenue increase (agentic AI adopters) | 6–10% | Across industries |
Revenue uplift range | 3–15% | Implementation-dependent |
Executives citing 6–10% growth | 53% | Google Cloud 2025 ROI study |
Documented case, Year 1 | $2M | Routing and information management improvements |
Documented case, Year 3 | $4M | Same system, compounding returns |
Google Cloud’s 2025 ROI of AI study found that 53% of executives reporting increased revenue cite growth in the 6–10% band. The average is achievable for most deployers. The gap between the 3% tail and the 15% tail is not about which model was chosen. It is about how the deployment was executed.
The documented case makes the point concrete. One company generated $2 million in additional revenue through better routing and information management in the first year. By year three, the same system produced $4 million without expanded scope. Returns compound when implementation aligns data quality and workflow design from day one, not when new capabilities are stacked on top.
AI Agent Productivity and Efficiency Statistics
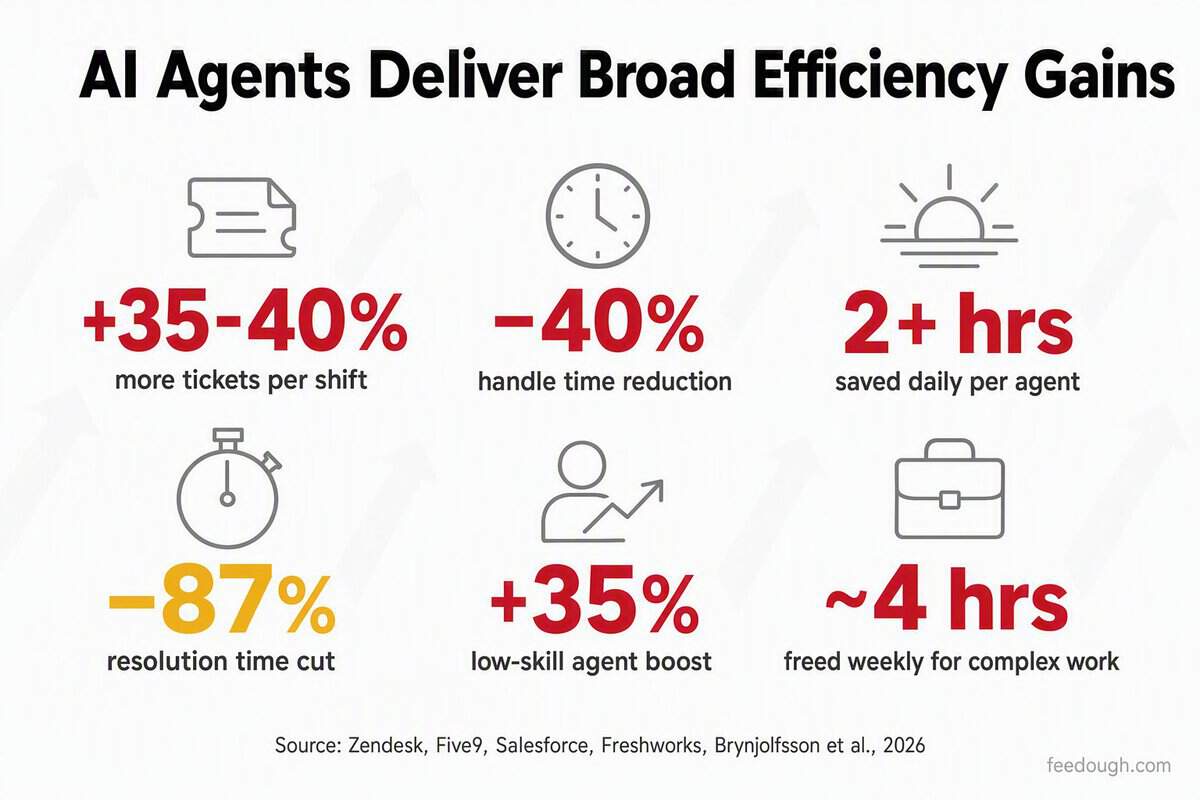
Support agents using AI tools handle 35-40% more tickets per shift with no increase in errors or decline in satisfaction. AI routing cuts average handle time by 40% by directing cases to the right agent on the first attempt. Service professionals using generative AI save over two hours daily.
Efficiency Metric | Improvement | Source |
|---|---|---|
Tickets per shift (AI tools) | +35-40% | Zendesk/ChatMaxima 2026 |
Handle time (AI routing) | -40% | Five9/ChatMaxima 2026 |
Daily time saved per agent | 2+ hours | Salesforce/ChatMaxima 2026 |
Complex case resolution time | -87% | Freshworks benchmarks |
Low-skill agent productivity boost | Up to +35% | Brynjolfsson et al./eDesk 2026 |
Weekly hours freed for complex work | ~4 hours | Salesforce State of Service 2026 |
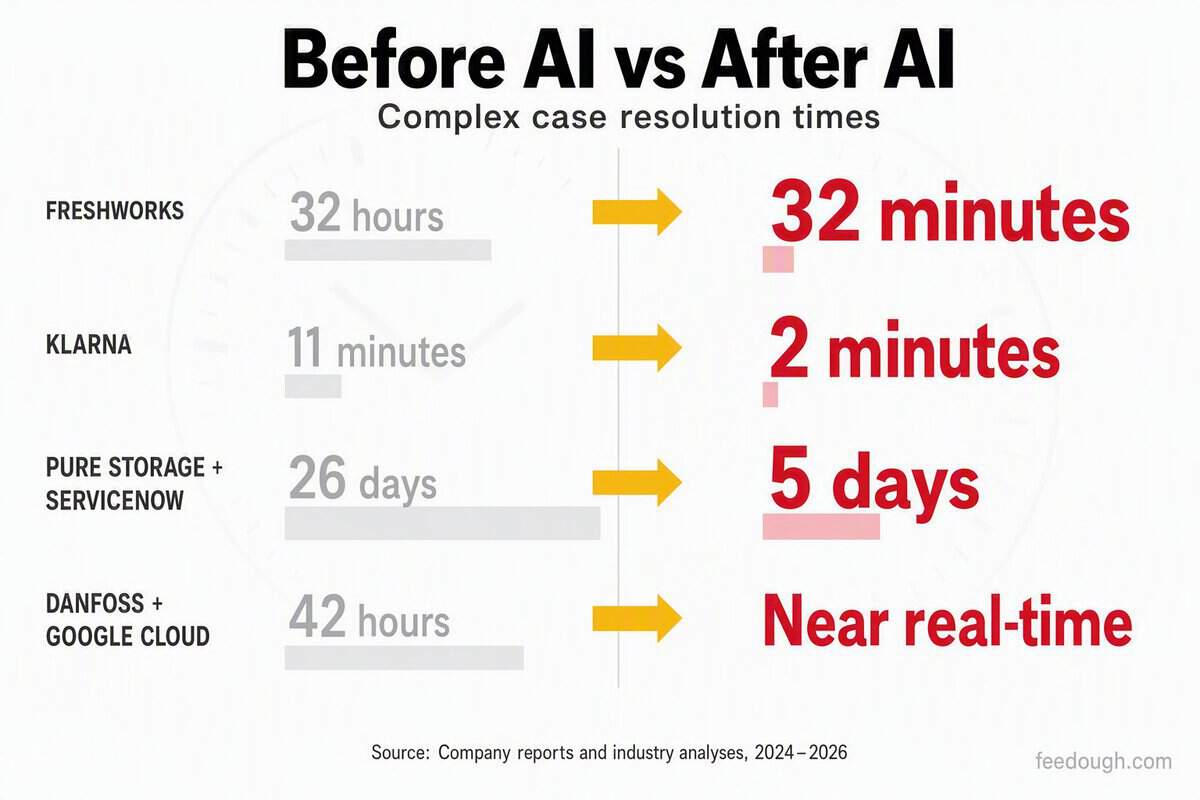
- Klarna’s AI assistant cut average issue resolution time from 11 minutes to 2 minutes (an 82% improvement) while handling two-thirds of all conversations, saving $60 million (equivalent to 853 full-time agents) as of Q3 2025
- Pure Storage reduced resolution time from 26 days to 5 days and response time from 26 minutes to 4 minutes after deploying ServiceNow’s AI agents
- Danfoss automated 80% of transactional decisions in email-based order processing, cutting average customer response time from 42 hours to near real-time
As autonomous resolution rates climb, the nature of support work shifts. Agents spend less time on routine queries and more on the cases requiring judgment and context.
AI Agent Support Efficiency and Productivity Statistics
A peer-reviewed study of 5,172 support agents measured a 15% overall productivity increase after AI tools were introduced. New or low-skill agents improved by up to 35%, suggesting the technology disproportionately benefits the workers who need it most. These findings from the Quarterly Journal of Economics anchor a broader pattern of AI agent efficiency gains now documented across industries.
- 35-40% more tickets handled per shift with no increase in errors or decline in customer satisfaction
- 40% reduction in average handle time through AI-powered routing and prioritization
- 2+ hours saved daily per agent by automating quick responses to routine queries
- 27% reduction in average handle time after deploying agent assist, now used by 40% of support units
Deployment | Metric | Before AI | After AI |
|---|---|---|---|
AI support teams (Freshworks) | Complex case resolution time | 32 hours | 32 minutes |
Klarna | Issue resolution time | 11 minutes | 2 minutes |
Pure Storage + ServiceNow | Resolution time | 26 days | 5 days |
Danfoss + Google Cloud | Order response time | 42 hours | Near real-time |
When routine queries resolve autonomously, the remaining human workload shifts toward cases requiring judgment and context. That reallocation is where the long-term productivity gain compounds.
AI Agents Marketing Cost Reduction Statistics: Savings by Function
AI-assisted SDR programs cut cost-per-meeting by 70% in 2026 cohorts. That single data point captures the pattern: savings concentrate where AI agents replace the most expensive human workflow steps.
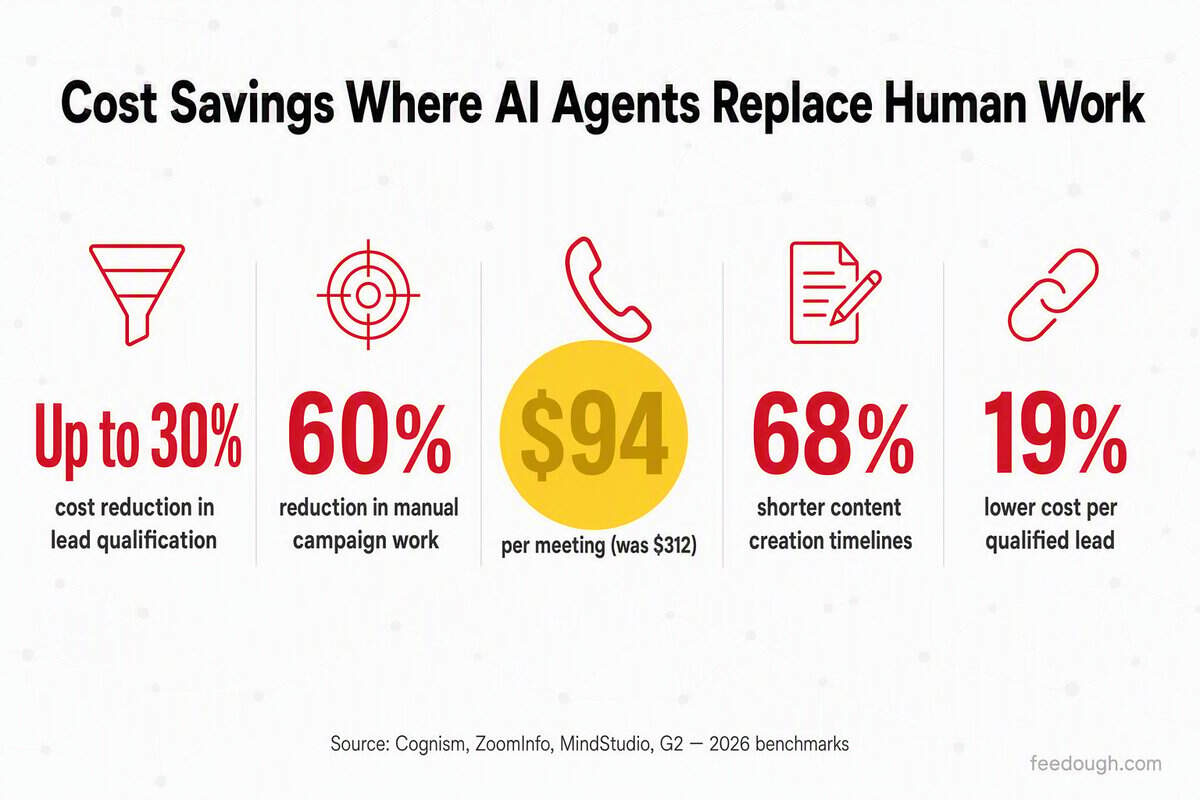
The aggregate marketing cost savings figure of 37% masks wide variation across functions. Lead qualification and campaign execution see the deepest cuts. Content production gains show up more in speed than direct cost reduction.
Marketing Function | Cost Impact | Mechanism |
|---|---|---|
Lead qualification | Up to 30% cost reduction | Automated screening, scoring, and routing |
Campaign optimization | 60% reduction in manual work | Multi-agent systems handling research through distribution |
SDR outreach | $312 to $94 per meeting | AI outreach paired with human qualification calls |
Content creation | 68% shorter timelines | Dynamic content adaptation at scale |
Combined pipeline | 19% lower cost per qualified lead | End-to-end workflow automation |
- 167% increase in qualified lead generation from AI-powered lead qualification
- 73% faster campaign development reported by marketing teams using AI agents
- Knowledge workers recover a median 6.4 hours per week per seat (approximately 333 hours per year)
- Multi-agent systems outperform single-agent approaches by 90.2% on complex marketing tasks
- 45% of marketing teams using at least one agentic AI system for automation in 2026, up from 15% in 2024
AI Agent Resolution Rates by Industry Vertical Statistics
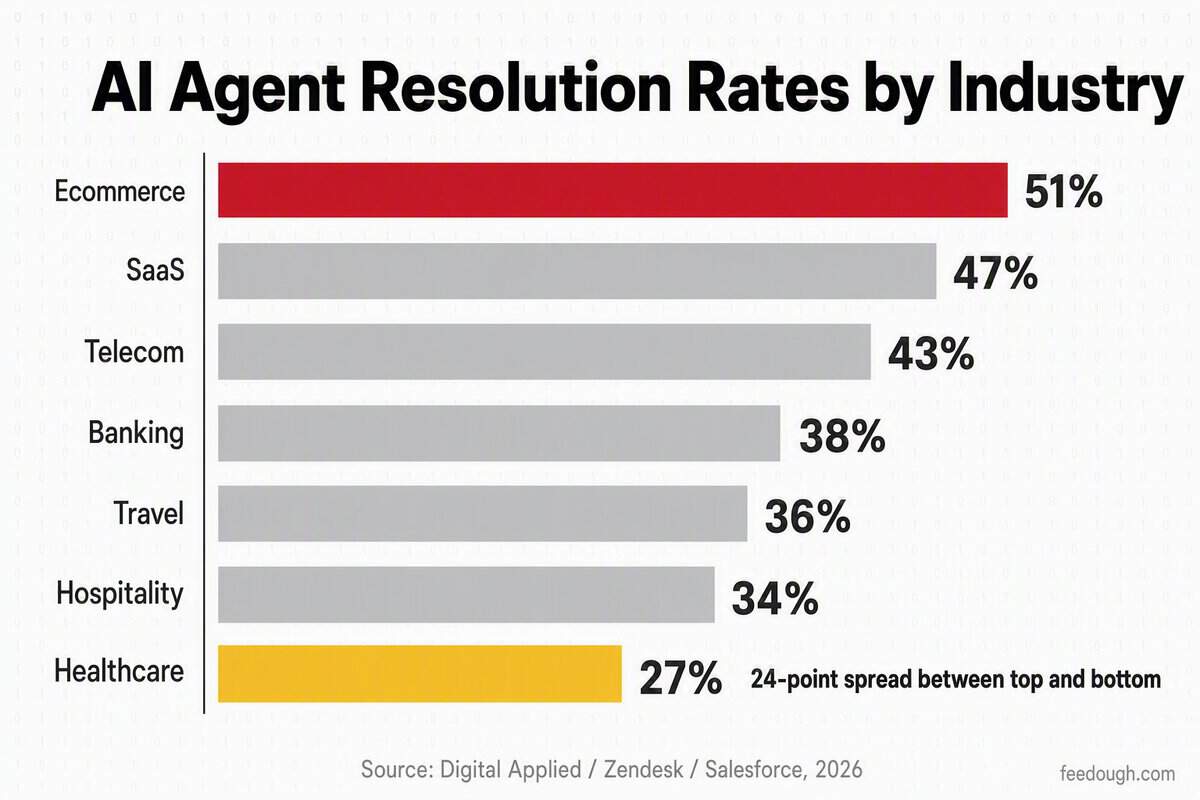
Ecommerce AI agents resolve 51% of queries without human help. Healthcare manages just 27%. The 24-point spread in AI agent resolution rates by industry is not driven by technology differences. It reflects what customers ask and how predictable those answers are.
Industry Vertical | Median AI Deflection Rate | Source |
|---|---|---|
Ecommerce | 51% | Digital Applied/Zendesk/Salesforce |
SaaS | 47% | Digital Applied/Zendesk/Salesforce |
Telecom | 43% | Digital Applied/Zendesk/Salesforce |
Banking | 38% | Digital Applied/Zendesk/Salesforce |
Travel | 36% | Digital Applied/Zendesk/Salesforce |
Hospitality | 34% | Digital Applied/Zendesk/Salesforce |
Healthcare | 27% | Digital Applied/Zendesk/Salesforce |
- Cross-industry median deflection rose 9.6 percentage points year-over-year to 41.2% in 2026, with top-quartile deployments hitting 58.7%
- Salesforce’s internal Agentforce deployment resolved 83% of queries autonomously across roughly 32,000 weekly conversations with no human escalation
- IT operations leads all departments in AI agent adoption at 65%+, followed by customer service at 58%+
The pattern holds because AI agents resolve repetitive, predictable queries far better than context-dependent ones. Order status and password resets are solved problems. Diagnostic troubleshooting and account-specific disputes are not.
AI Agents Customer Service Statistics: Speed, Cost & Satisfaction Metrics
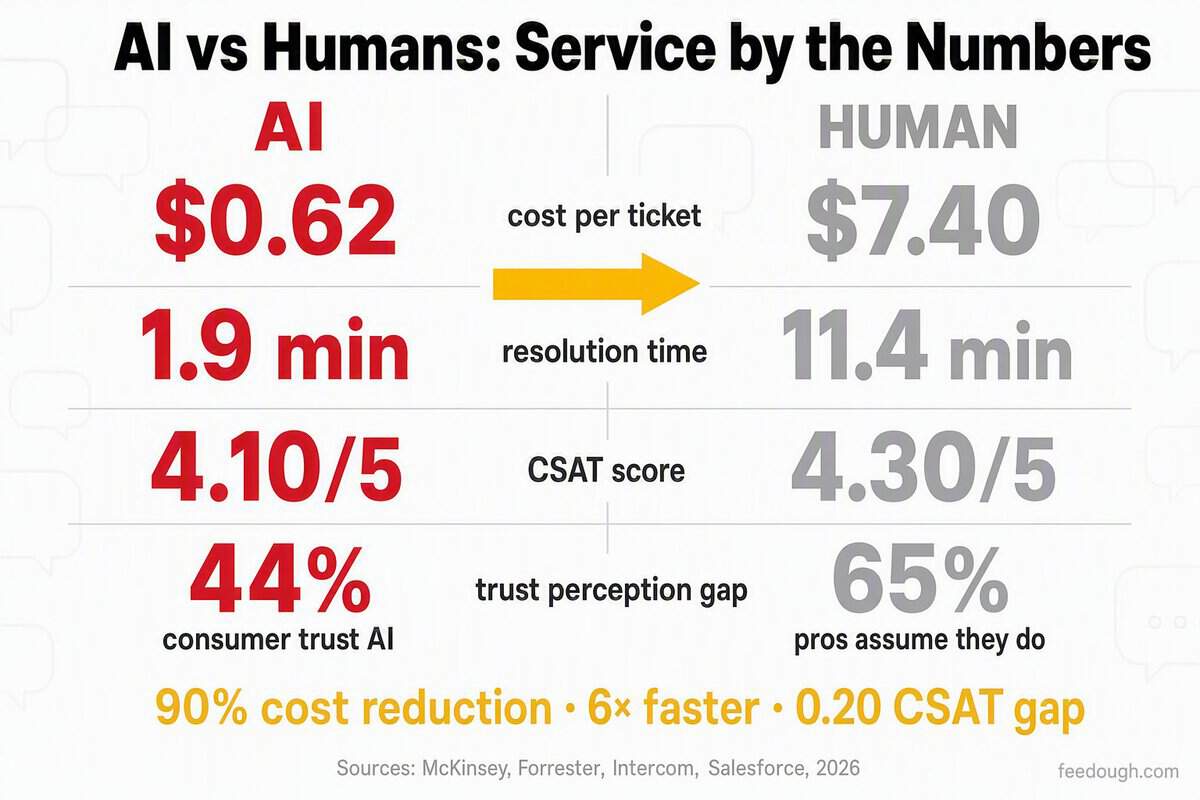
AI customer service agents resolve tickets for $0.62 on average, compared to $7.40 for human agents. That 90% cost reduction (McKinsey) is only half the story. AI handles issues in 1.9 minutes versus 11.4 minutes for humans, a 6x speed advantage that compounds the savings.
Channel | Speed Comparison |
|---|---|
All channels combined | 1.9 min (AI) vs 11.4 min (human) |
Chat | 6.0x faster with AI |
Email | 4.4x faster with AI |
Voice | 3.7x faster with AI |
Satisfaction nearly matches. AI-handled tickets average 4.10 on CSAT versus 4.30 for humans, with the gap narrowing to 0.05 under hybrid flows (Intercom). The constraint is trust, not quality. Only 44% of consumers say they trust AI for service needs, while 65% of service professionals assume they already do. That 21-point perception gap (Salesforce) is the adoption bottleneck.
- 70% of adopters observe measurable value within 60 days of deployment
- 64% of enterprise CX teams ran an agentic AI pilot in 2026, but only 27% had at least one channel in full production
- Median time from pilot to production: 4.7 months
AI Agent Autonomous Resolution Rate Benchmarks
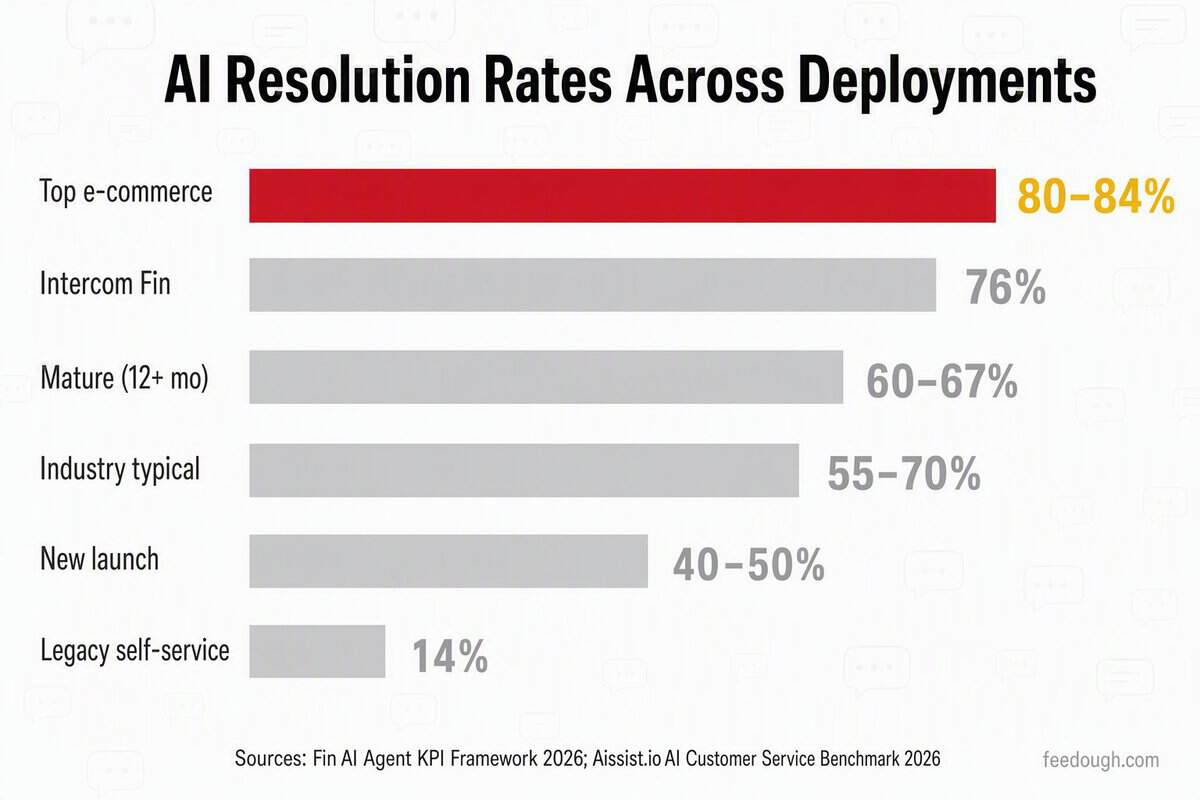
Intercom Fin now resolves 76% of customer queries without human intervention across 12,000 deployments, up from 67% in 2025. Roughly one percentage point of monthly improvement has held steady for 24 consecutive months. Independent enterprise programs typically land well below that number.
Deployment Scenario | Resolution Rate | Notes |
|---|---|---|
Top-performing ecommerce and subscription | 80–84% | Mature knowledge bases, well-structured catalogs |
Intercom Fin (vendor-reported) | 76% | 12,000 customers; up from 67% in 2025 |
Industry production range (structured tier-1) | 55–70% | Cross-platform benchmark for standard traffic |
Mature deployments at 12+ months | 60–67% | After workflow optimization and documentation maturation |
New deployments at launch | 40–50% | Baseline; improves approximately one point per month |
Traditional self-service (FAQ, help docs) | 14% | Legacy benchmark for comparison |
How you count resolution matters. Counting conversations where customers gave up inflates reported rates by 20 to 40 percentage points. Only counting issues genuinely resolved end-to-end produces the more reliable benchmark. Technology architecture adds another layer of variance: agentic AI systems typically resolve 10 to 20 points higher than retrieval-based bots, and giving agents the ability to take actions like refunds adds another 20 to 30 points versus information retrieval alone.
AI Agent Productivity Transformation: Time Saved, Speed & Workflow Statistics
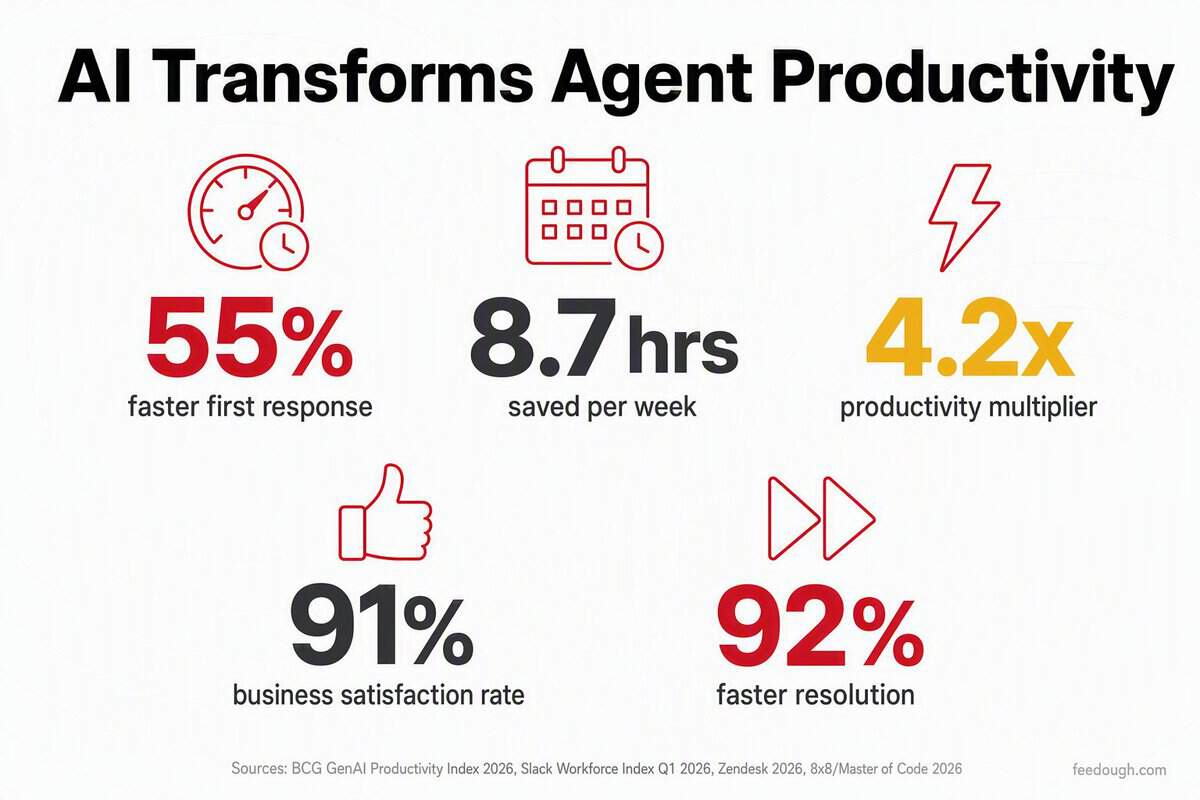
Support agents using purpose-built AI tools report a 55% reduction in average first response time. That speed gain reshapes the entire workday. When the first reply lands in half the usual time, follow-ups compress, backlogs shrink, and service professionals reclaim hours for higher-value work. BCG and Slack’s 2026 workforce data measures 8.7 hours saved per week, with a 4.2x productivity multiplier for customer service agents.
- 84% of agents say AI makes responding to tickets easier
- 79% of support agents report AI copilots enhance their ability to deliver standout customer experiences
- 73% of support agents are confident AI copilots improve their ability to do their job
- 75% of customers support human agents using AI to draft customer service responses
- 91% of businesses with AI deployed in support units are satisfied with the effects
Workflow Metric | Value | Source |
|---|---|---|
First response time reduction | 55% | Unthread, 2026 |
Time saved per week (CS agents) | 8.7 hours | BCG GenAI Productivity Index, 2026 |
Productivity multiplier (CS agents) | 4.2x | Slack Workforce Index Q1 2026 |
Resolution speed improvement (Freedom Furniture) | 92% faster | Zendesk, 2026 |
Customer satisfaction improvement (Freedom Furniture) | +17% | Zendesk, 2026 |
Freedom Furniture makes the pattern concrete. By deploying AI copilots to guide agents through complex tickets, the retailer achieved 92% faster resolution and a 17% boost in CSAT. When AI improves the workflow rather than replacing the worker, agent-side sentiment translates into customer-side outcomes.
AI Agents by Industry: Healthcare, Insurance and Retail Impact Statistics
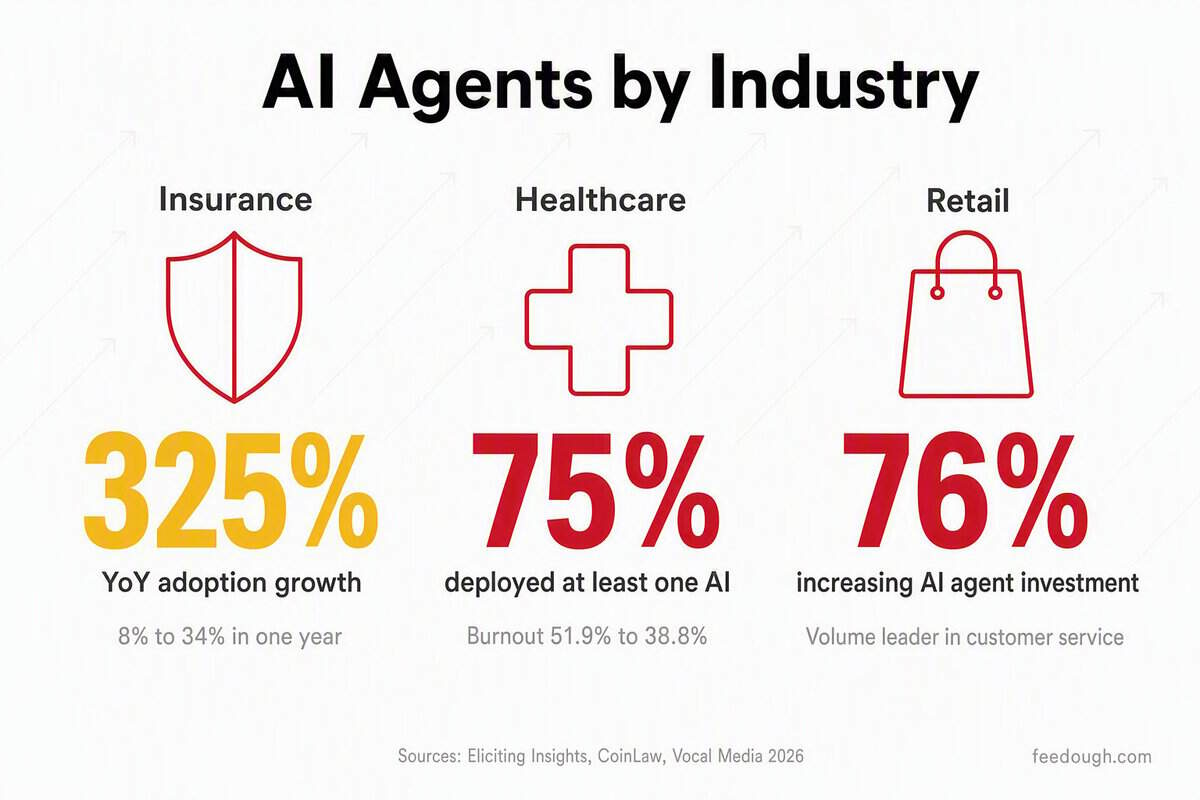
Full value chain AI adoption in insurance jumped from 8% to 34% in a single year. That 325% increase is the fastest adoption curve across any sector in the data. Healthcare and retail are moving at very different speeds toward very different outcomes.
Industry | Key Metric | Trend |
|---|---|---|
Retail | 76% increasing AI agent investment for customer service | Volume leader, top use case driving expansion |
Healthcare | 75% deployed at least one AI solution | Up from 59% in 2025 |
Healthcare | 68% implementing ambient listening AI | Up from 42% in 2025 (62% YoY growth) |
Healthcare | 43% adopted clinical documentation improvement tools | 71% of implementers report 2x or higher ROI |
Insurance | 34% fully adopted AI into value chain | Up from 8% in 2024 (325% YoY) |
Insurance | 91% expected to adopt AI by 2026 | 76-80% already in pilot or planning adoption |
Healthcare’s slower adoption pace masks a different kind of progress. AI agents in clinical documentation reduced clinician burnout from 51.9% to 38.8%. Among organizations implementing clinical CDI tools, 71% report 2x or higher ROI. These are workforce sustainability outcomes neither retail nor insurance has replicated. Insurance compensates with speed. Routine claims process 40-60% faster through AI automation, and the $80 billion annual fraud burden is driving adoption of AI-powered detection systems.
- 68% of health systems now use ambient listening AI for clinical note-taking, up from 42% in 2025
- Clinician burnout dropped from 51.9% to 38.8% after short-term use of AI-assisted documentation tools
- 40-60% faster processing for routine insurance claims through AI automation
- $80 billion in annual U.S. insurance fraud costs accelerating AI detection investment
The divergence starts after the first deployment. Retail stays concentrated in customer service. Healthcare pushes into clinical workflows where outcomes appear as burnout reduction and documentation ROI. Insurance races toward full value chain coverage. AI-leading insurers now generate 6.1x the shareholder returns of slower adopters, making integration speed the defining competitive variable.
AI Agent Predictions and Workforce Impact Statistics 2026
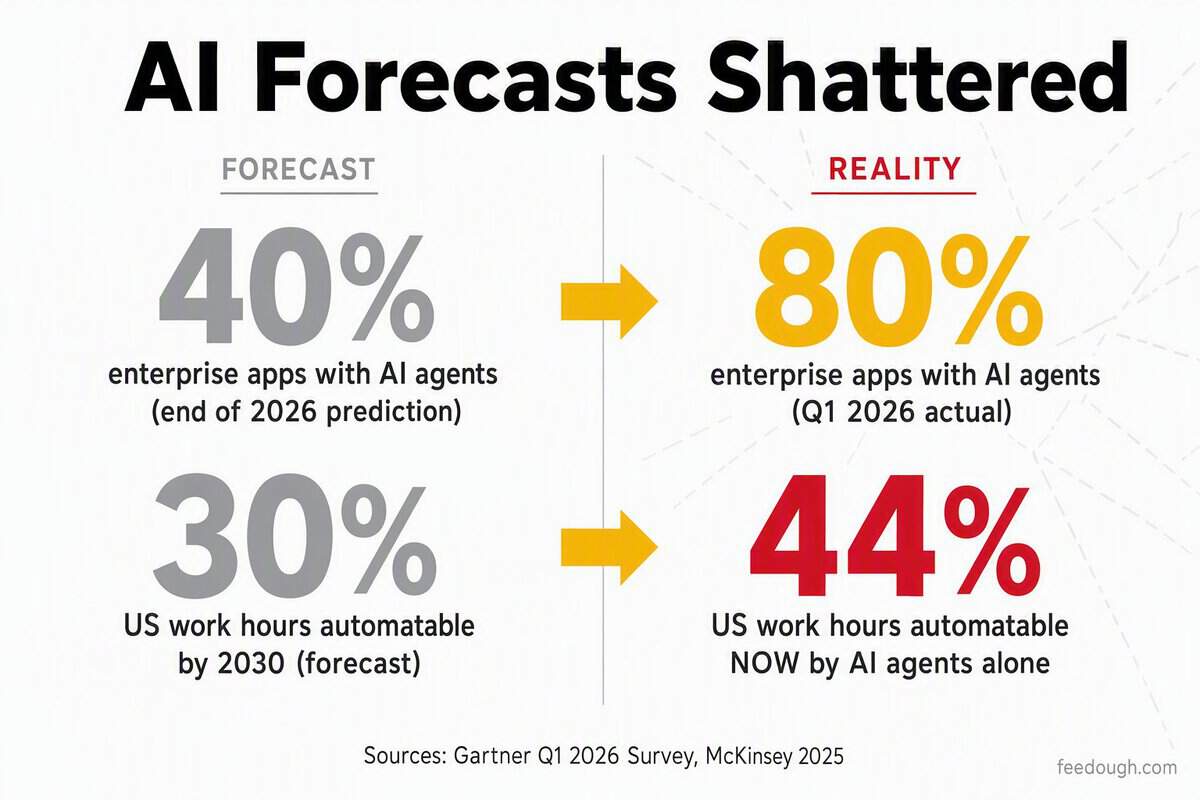
Gartner predicted 40% of enterprise applications would embed AI agents by the end of 2026. The actual number hit 80% by Q1. Adoption is outrunning the forecasts that were supposed to measure it.
McKinsey now estimates AI agents alone can handle 44% of US work hours with current technology, nearly doubling the previous 30% forecast. Robots add another 13%. The automation ceiling is higher and closer than the 2030 projections assumed.
Metric | Forecast | Source |
|---|---|---|
Enterprise apps with integrated AI agents | 80% by Q1 2026 (2x original prediction) | Gartner |
G2000 job roles involving AI agents | 40% by 2026 | IDC |
Business tasks automatable by AI agents | 15–50% by 2027 | WeAreTenet |
US work hours technically automatable | 44% with current technology | McKinsey |
Agentic AI share of enterprise software revenue | 30% by 2035 | Gartner |
Potential annual US economic value (AI agents & robots) | $2.9 trillion by 2030 | McKinsey |
Over 90% of global enterprises will face critical AI skills shortages by 2026. IDC estimates the gap places up to $5.5 trillion in economic value at risk. AI talent demand exceeds supply by 3.2 to 1, with 1.6 million open positions and only 518,000 qualified candidates worldwide.
The structural consequences are already visible. 66% of enterprises are reducing entry-level hiring as AI agents absorb the routine work that once trained new employees. Another 20% are using AI to flatten organizational structure, eliminating more than half of middle management positions. The pipeline that was supposed to develop future leaders is being automated before it can deliver.
Sources
- https://www.marketsandmarkets.com/blog/ICT/ai-agents-market (2025)
- https://www.bccresearch.com/pressroom/ait/ai-agents-market-to-grow-433–annually (2026-01-05)
- https://www.mordorintelligence.com/industry-reports/healthcare-agentic-artificial-intelligence-market (2025)
- https://www.digitalapplied.com/blog/ai-agent-adoption-2026-enterprise-data-points (2026)
- https://bayelsawatch.com/ai-customer-service-statistics (2026)
- https://www.accelirate.com/agentic-ai-statistics-2026 (2026-03-23)
- https://www.digitalapplied.com/blog/agentic-ai-statistics-2026-definitive-collection-150-data-points (2026)
- https://iternal.ai/ai-agent-security-checklist (2026)
- https://cycode.com/blog/ai-security-vulnerabilities (2026)
- https://www.capgemini.com/insights/research-library/ai-agents/ (2025)
- https://www.grandviewresearch.com/industry-analysis/ai-agents-market-report (2025)
- https://paul-okhrem.com/enterprise-ai-agents-statistics-2026 (2026-04-01)
- https://www.cybersecurity-insiders.com/2026-ciso-ai-risk-report/ (2026-01-24)
- https://www.helpnetsecurity.com/2026/03/03/enterprise-ai-agent-security-2026/ (2026-03-03)
- https://www.arcade.dev/blog/5-takeaways-2026-state-of-ai-agents-claude (2026)
- https://www.digitalapplied.com/blog/ai-agent-productivity-statistics-2026-roi-data-points (2026-04-20)
- https://fin.ai/learn/roi-ai-customer-service-agents-benchmarks (2026)
- https://www.ringly.io/blog/ai-agent-statistics-2026 (2026-06-03)
- https://www.mavvrik.ai/blog/ai-cost-statistics-2026 (2026)
- https://www.googlecloudpresscorner.com/2025-09-04-Google-Cloud-Study-Reveals-52-of-Executives-Say-Their-Organizations-Have-Deployed-AI-Agents,-Unlocking-a-New-Wave-of-Business-Value,1 (2025-09-04)
- https://www.edesk.com/blog/ai-customer-service-works (2026-02-17)
- https://chatmaxima.com/blog/ai-customer-support-statistics-2026 (2026-02-18)
- https://www.digitalapplied.com/blog/ai-customer-support-statistics-2026-adoption-roi-data (2026-04-20)
- https://www.taskade.com/blog/history-of-servicenow (2026)
- https://newsroom.servicenow.com/press-releases/details/2026/Mobile-World-Congress-2026-Autonomous-CRM-puts-AI-to-work-in-telecom/default.aspx (2026-02)
- https://blog.google/innovation-and-ai/infrastructure-and-cloud/google-cloud/ai-business-trends-report-2026 (2026)
- https://www.chatbase.co/blog/ai-customer-service-statistics (2026-08-20)
- https://aelumconsulting.com/blogs/servicenow-autonomous-workforce (2026)
- https://masterofcode.com/blog/ai-in-customer-service-statistics (2026-08-03)
- https://thesmarketers.com/blogs/ai-agents-b2b-marketing (2026)
- https://www.mindstudio.ai/blog/ai-agents-for-marketing-teams (2026)
- https://www.digitalapplied.com/blog/lead-generation-statistics-2026-marketing-data (2026)
- https://www.digitalapplied.com/blog/marketing-automation-statistics-2026-data-points (2026)
- https://www.digitalapplied.com/blog/customer-service-ai-agent-statistics-2026-data (2026-04-22)
- https://www.lorikeetcx.ai/articles/ai-customer-service-statistics (2026-03)
- https://sqmagazine.co.uk/ai-agents-statistics (2026)
- https://www.ringly.io/blog/customer-service-cost-statistics-2026 (2026-06-03)
- https://fin.ai/learn/ai-agent-kpis-enterprise-performance-metrics-framework (2026)
- https://aissist.io/industries/ai-customer-service-benchmark-2026 (2026-07-05)
- https://www.zendesk.com/blog/zendesk-insights/expertise/agent-copilots-the-essential-ingredient-for-ai-success-in-2025 (2026-01-13)
- https://agentman.ai/blog/healthcare-ai-adoption-2026-survey-data (2026-03-27)
- https://vocal.media/futurism/ai-in-healthcare-statistics-and-facts-2026 (2025)
- https://coinlaw.io/ai-in-insurance-industry-statistics (2026-02-08)
- https://www.snsinsider.com/reports/ai-in-insurance-market-8550 (2025)
- https://www.mckinsey.com/mgi/our-research/agents-robots-and-us-skill-partnerships-in-the-age-of-ai (2025-10-20)
- https://www.workera.ai/guides-reports/the-5-5-trillion-skills-gap-what-idcs-new-report-reveals-about-ai-workforce-readiness (2025)
- https://finance.yahoo.com/news/idc-futurescape-2026-predictions-reveal-123000266.html (2025-11-25)
- https://www.forbes.com/sites/cindyrodriguezconstable/2026/06/30/management-cuts-today-are-shaping-a-leadership-shortage (2026-06-30)
- https://iternal.ai/ai-skills-gap (2026)