[Reader Disclosure]Our content is reader-supported. This means we may earn a commission if you click on some of our links.
Netflix is the biggest and most popular video streaming platform globally.
With such a massive pool of movies and shows, streaming content over the Internet is the best way, and without a doubt, Netflix is the top choice among users. Though it started as a DVD rental service and added the subscription model later on, it has now started to produce original content, which is a major attraction for the subscribers to pay for the streaming service.
Here are some key Netflix statistics with respect to users, revenues, expenses, and content.
Netflix is an online video streaming service that allows users to watch movies and TV shows on an internet-connected device through a paid subscription. It offers viewers a commercial-free and easy-to-use platform with visible user ratings and rankings.
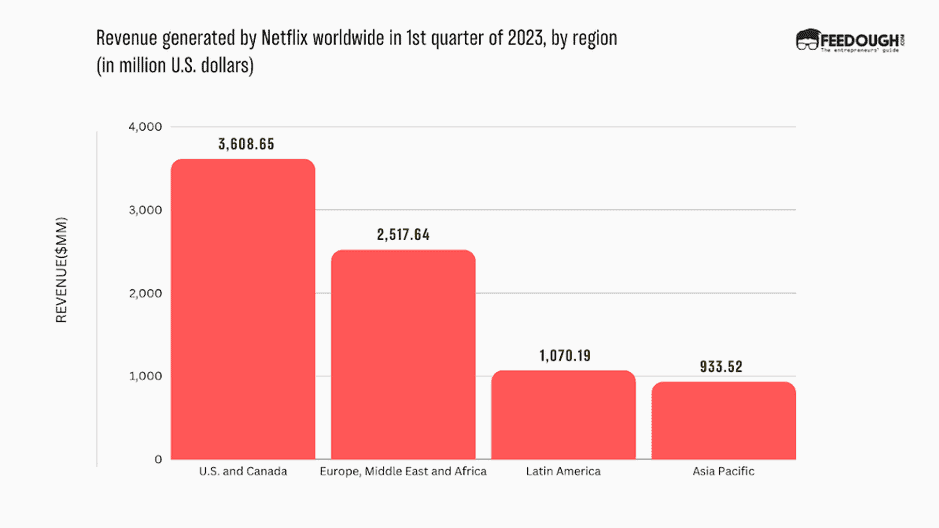
Netflix made $14.085 billion from the US and Canada in 2022, up from $12.972 billion in 2021. (Source: Netflix)
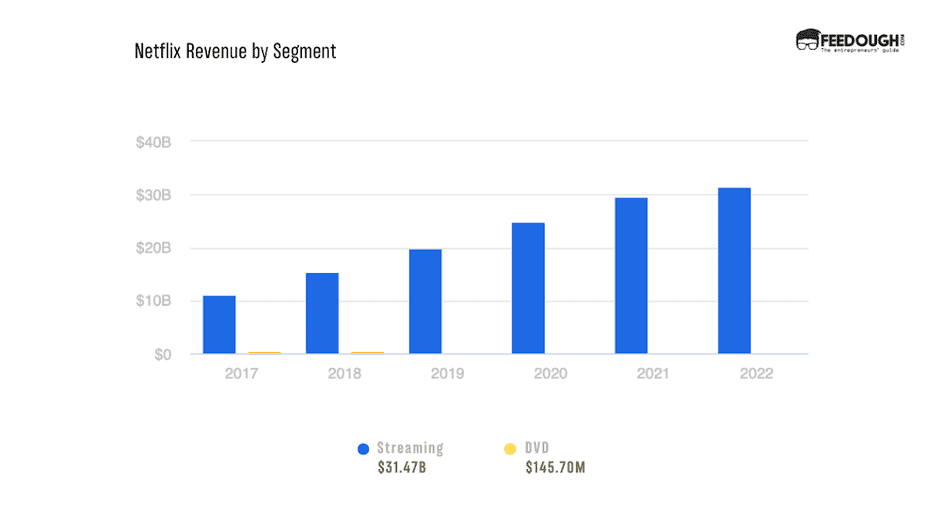
Netflix Revenue By Segment
Netflix made $145.698 million from DVDs in 2022, down from $182.348 million in 2021. (Source: Netflix)
Operating Income: Netflix’s annual operating income for 2022 was $5.633B, a 9.07% decline from 2021.
Net Income: Netflix’s annual net income for 2022 was $4.492B, a 12.2% decline from 2021.
Operating Income: 14.21% as of December 2022.
Average Market Cap: 130.38B as of March 10, 2023.
Netflix Operating Income: Netflix’s annual operating expenses for 2022 were $25.983B, a 10.55% increase from 2021.
Number of Employees: 12,800 in 2022, a 13.27% increase from 2021.
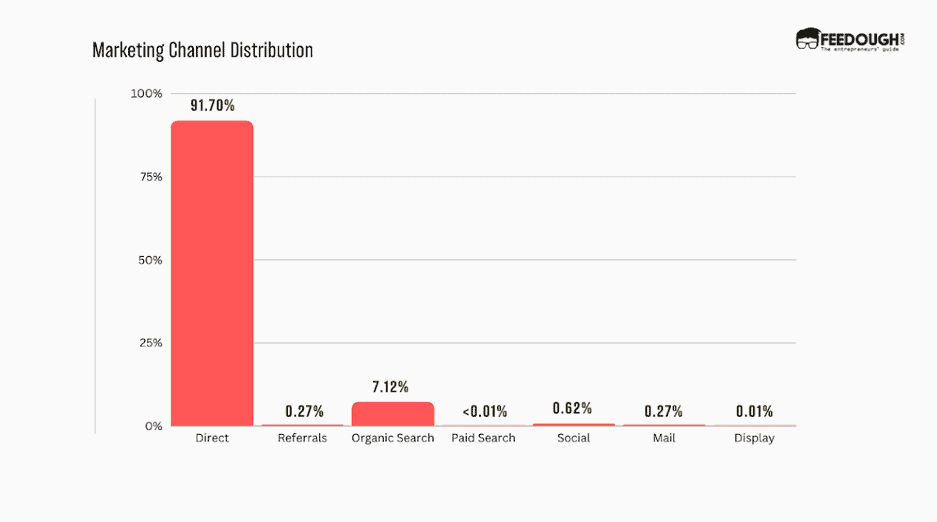
Netflix Marketing Channels Distribution
The top traffic source to netflix.com is Direct traffic, driving 91.07% of desktop visits in March 2023, and Organic Search is the 2nd with 7.12% of traffic. The most underutilised channel is Paid Search.
Netflix Statistics: Content
US library size: 5087 titles in total, with 1,974 shows and 3,749 movies as of August 2021.
English titles make up around 55% of the total Netflix library in the United States, which means 45% are foreign-language titles.
Most viewed original movie: The Red Notice as of October 2022.
Most viewed original series: English – Stranger Things (Season 4) – 1,352,090,000 hours watched, Non-English – Squid Game (Season 1) – 1,650,450,000 hours watched.
Amount spent on original content production: 16.84 billion US dollars in th year 2022, which was 4.9% less than in the year 2021, when it shelled out $17.70 billion.
Netflix Miscellaneous Stats and Facts
In the 4th quarter of 2021, the viewer’s ratio of men to women was 50:50.
Netflix can spend up to $20 million per hour on content.
Netflix original series – The Crown cost $13 million per episode.
Slovakia has the largest Netflix catalogue in the year 2023 – combining 7,436 different titles.
The average (US.) Netflix subscriber earns less than $50,000 a year.
Netflix produced approx 130 original titles in Q3 2021.
Pakistan has the lowest Netflix subscription cost.
During the third quarter of 2022, the Netflix mobile app amassed more than 8.4 million downloads from users in the United States.
The television is the most used device to watch TV shows on Netflix in the United with over 133 million unique viewers, followed by the mobile phone with 74.8 unique million viewers.
On average, it takes five days for a user to binge-watch a series on Netflix.
As of August 5th, 2020, Netflix has 1,767 active Originals; of those, 1,140 are in English. That is, about 65% of all Netflix Originals are in English.
An ardent reader, full-time writer and a lover of all things purple. Riya is an entrepreneurial spirit, making her way in the start-up industry through her expressive writing. When not working, you can find her jamming to music, watching period films, eating sushi, or petting cats.
Each week I share research backed AI oriented content in my newsletter.
There are AI ideas, AI trends, tutorials, and guides.
24k entrepreneurs read it. I'd love you to join.