[Reader Disclosure]Our content is reader-supported. This means we may earn a commission if you click on some of our links.
For a company with a big portfolio, it’s important to assess its product lines regularly to see which product is profitable, which is making losses, and which ones need some work. This practice helps the company to allocate its resources accordingly in order to function more efficiently.
While many practices and tools are available to the company to accomplish this mission, the BCG matrix, developed by the Boston Consulting Group, is considered a gold standard for finding the cash cows, the stars, the question marks, and the dogs.
But what is the BCG matrix, and what do these terms mean?
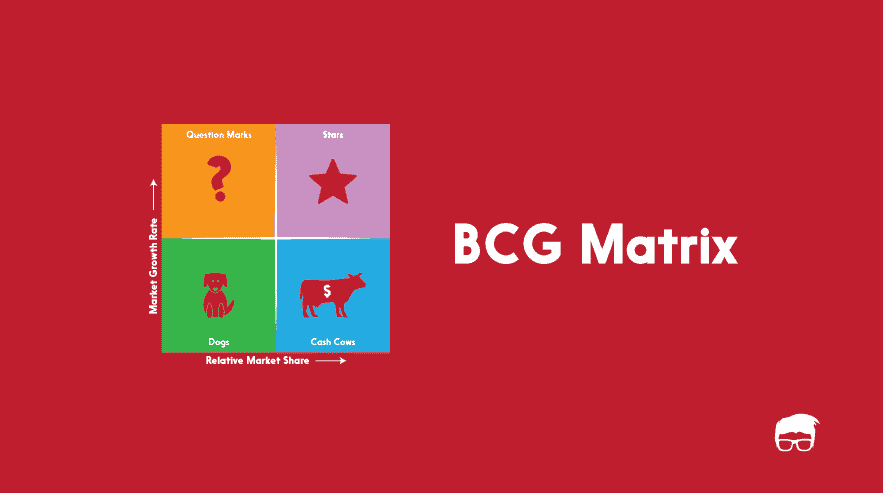
BCG matrix (also called Growth-Share Matrix) is a portfolio planning model used to analyse the products in the business’s portfolio according to their growth and relative market share.
The model is based on the observation that a company’s business units can be classified into four categories:
Cash Cows
Stars
Question Marks
Dogs
It is based on the combination of market growth and market share relative to the next best competitor.
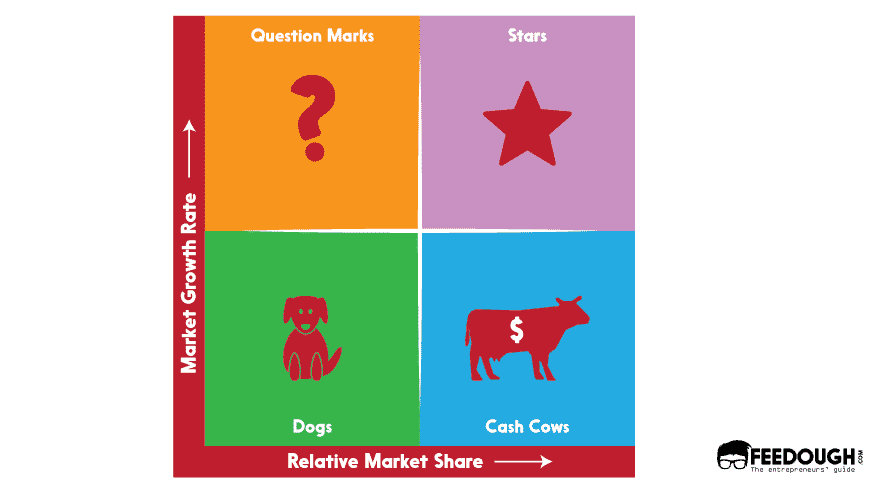
Stars
High Growth, High Market Share
Star units are leaders in the category. These products have –
A significant market share, hence they bring the most cash to the business.
A high growth potential that can be used to increase further cash inflow.
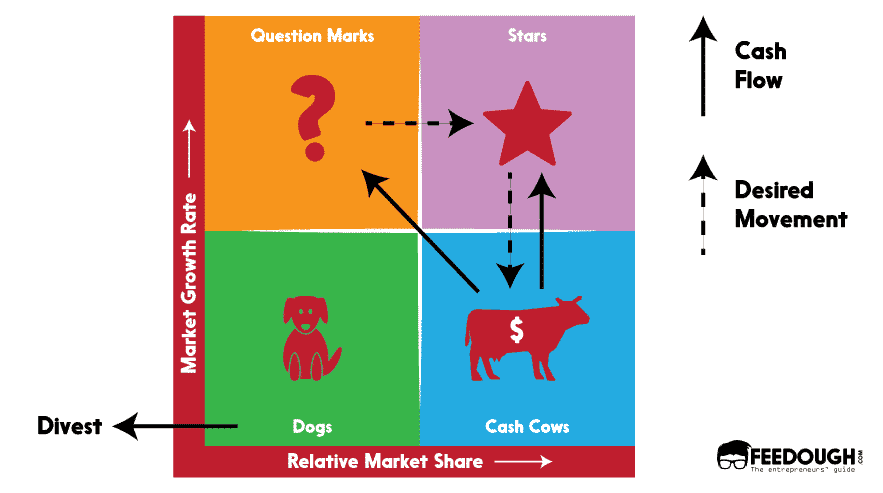
With time, when the market matures, these stars become cash cows that hold huge market shares in a low-growth market. Such cows are milked to fund other innovative products to develop new stars.
Cash Cows
Low Growth, High Market Share
Cash cows are products with significant ROI but operating in a matured market which lacks innovation and growth. These products generate more cash than it consumes.
Usually, these products finance other activities in progress (including stars and question marks).
Dogs
Low Growth, Low Market Share
Dogs hold a low market share and operate in a market with a low growth rate. Neither do they generate cash, nor do they require huge cash. In general, they are not worth investing in because they generate low or negative cash returns and may require large sums of money to support. Due to low market share, these products face cost disadvantages.
Question Marks
High Growth, Low Market Share
Question marks have high growth potential but a low market share which makes their future potential to be doubtful.
Since the growth rate is high here, with the right strategies and investments, they can become cash cows and ultimately stars. But they have a low market share so wrong investments can downgrade them to Dogs even after lots of investment.
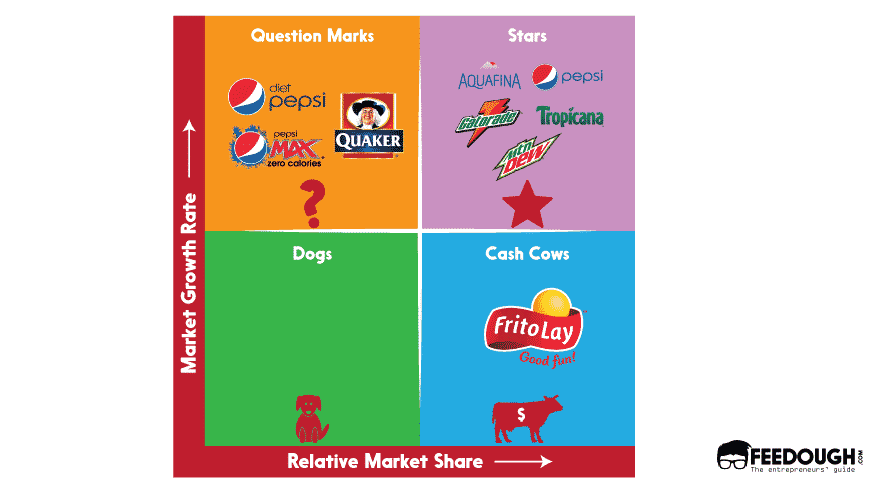
A perfect example to demonstrate the BCG matrix could be the BCG matrix of Pepsico. The company has perfected its product mix over the years according to what’s working and what’s not.
Here are the four quadrants of Pepsico’s growth-share matrix:
Cash Cows – With a US market share of 58.8%, Frito Lay is the biggest cash cow for Pepsico.
Stars – Even though Pepsi’s share in the market has been reduced to 8.4%, it’s still the star for Pepsico because of its brand equity. Other stars are Aquafina (the biggest selling mineral water brand in the USA), Tropicana, Gatorade, and Mountain Dew.
Question Marks – Since it’s a mystery whether the diet food and soda industry will boom in the future and will Pepsico’s products will find their place or not, Diet Pepsi, Pepsi Max, Quaker, etc. fall in the question marks section of the Pepsico’s BCG matrix.
Dogs – As of now, there isn’t any product line that falls in the dogs section of Pepsico’s BCG matrix. However, seasonal and experimental products like Pepsi Real Sugar, and Mtn Merry Mash-up can be inserted in this section.
How To Make A BCG matrix?
So far, we know products are classified into four types. Now we will see on what basis and how that classification is done.
We shall understand the five processes of making a BCG matrix better by making one for L’Oréal in the following sections.
Step 1: Choose the product
BCG matrix can be used to analyse Business Units, separate brands, products or a firm as a unit itself. The choice of the unit impacts the whole analysis. Therefore, defining the unit is necessary.
Step 2: Define the market
An incorrectly defined market can lead to a poor classification of products. For example, if we would analyse Daimler’s Mercedes-Benz car brand in the passenger vehicle market, it would end up as a dog (it holds less than 20% relative market share), but it would be a cash cow in the luxury car market. Therefore, defining the market accurately is an important prerequisite for better understanding the portfolio position.
Step 3: Calculate the relative market share
Market share is the percentage of your company’s total market that is being catered to, measured either in revenue terms or unit volume terms.
We use Relative Market Share in a BCG matrix, comparing our product sales with the leading rival’s sales for the same product.
Relative Market Share = Product’s sales this year/Leading rival’s sales this year
For example, if your competitor’s market share in the automobile industry was 25% and your firm’s brand market share was 10% in the same year, your relative market share would be only 0.4. Relative market share is given on the x-axis.
Step 4: Find out the market growth rate
The industry growth rate can be easily found through free online sources. It can also be calculated by determining the average revenue growth of the leading firms. The market growth rate is measured in percentage terms.
Market growth rate is usually given by: (Product’s sales this year – Product’s sales last year)/Product’s sales last year
Markets with high growth are ones where the total market share available is expanding, so there are a lot of opportunities for all companies to make money.
Step 5: Draw the circles on a matrix
Having calculated the above measures, now you need to just plot the brands on the matrix. The x-axis shows the relative market share, and the y-axis shows the industry growth rate. You can plot a circle for each unit/brand/product, the size of which should ideally correspond to the proportion of revenue generated by it.
BCG Matrix Example
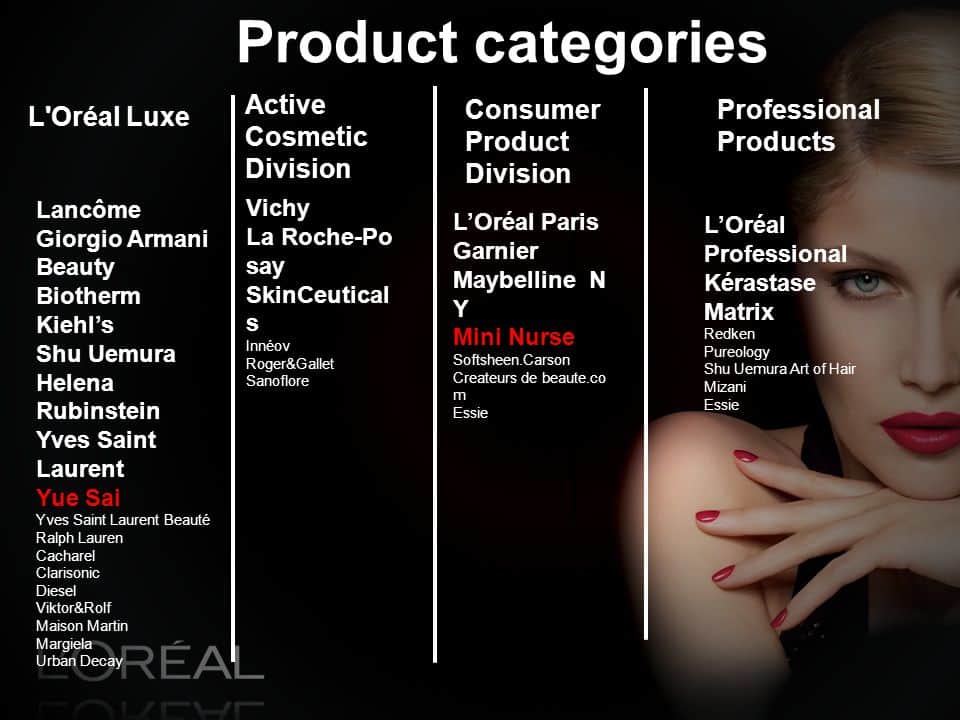
Let us consider the BCG matrix of L’Oréal, for example.
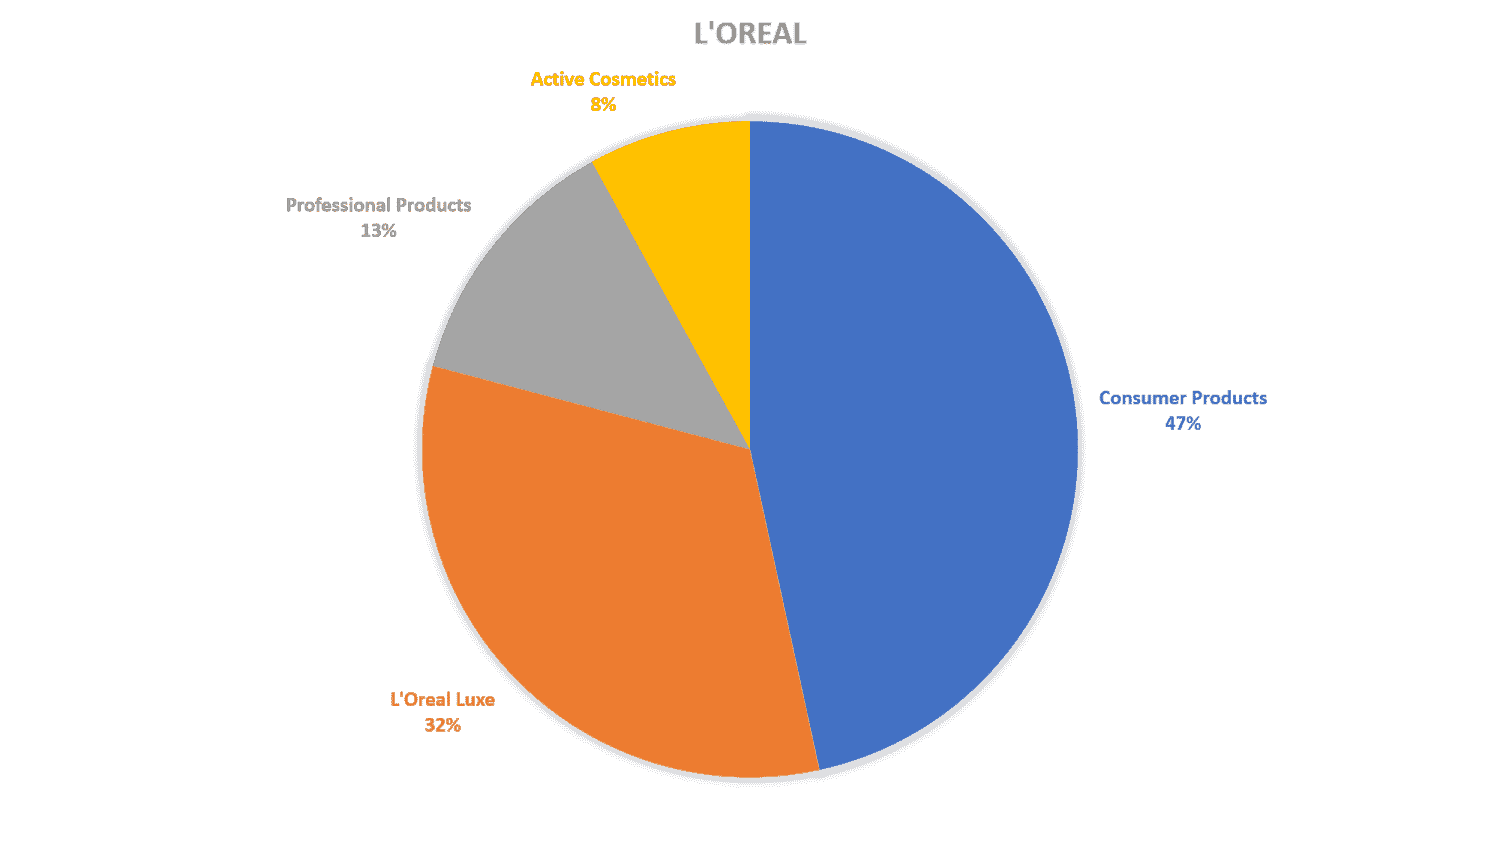
For a simpler understanding, we look at L’Oreal’s business segments and overall growth.
Step 1: Choose the product/firm/brand
We choose the firm L’Oreal for analysis.
Step 2: Identify Market
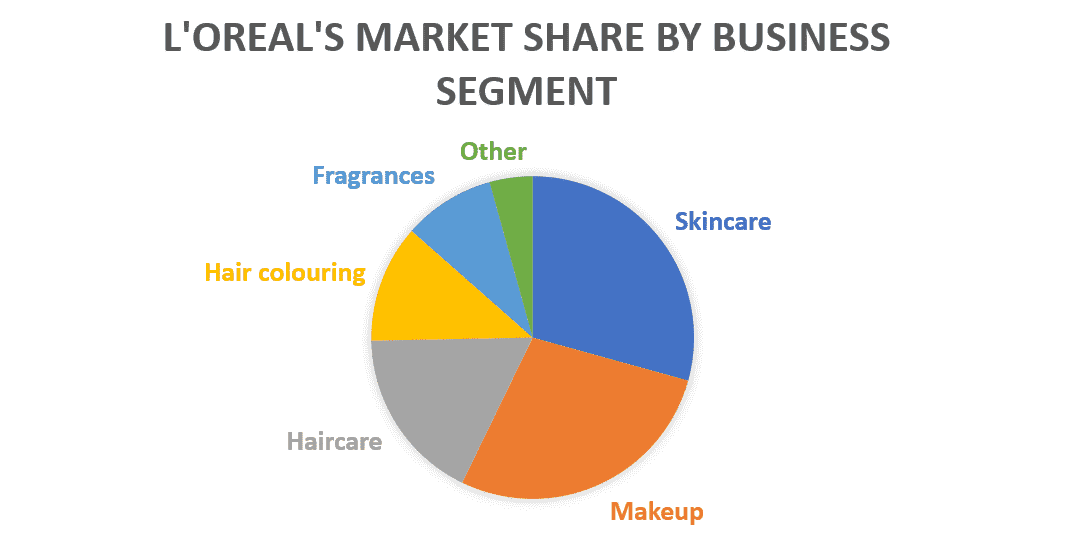
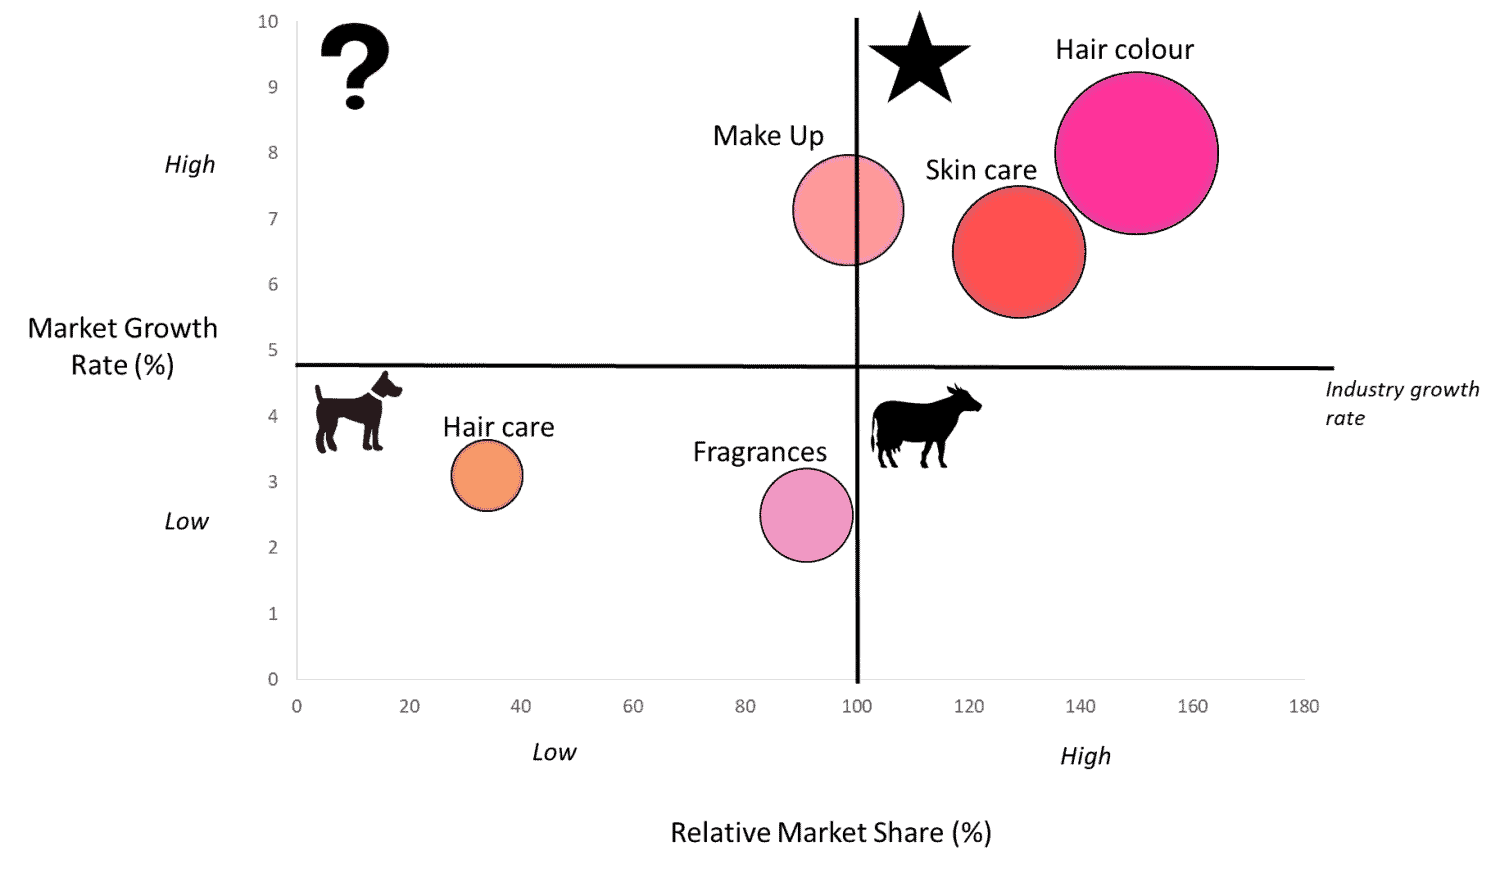
The chosen market is the Cosmetics Industry which includes primarily- Skincare, Makeup, Haircare, Hair colour and Fragrances.
Step 3: Calculate Relative Market Share
Tabulated below:
L’Oreal Category
Market Share(1)
Leading Rival
Rival’s Market Share(2)
Relative Market Share(1)/(2)
Category Growth Rate
Skincare
$31.6 bn
Unilever
$24 bn
129%
6.5%
Make- Up
$27.1 bn
P&G
$27.5 bn
98.5%
7.14%
Hair Care
3%
Unilever
8.84%
33.9%
3.1%
Hair Colour
9%
Henkel
6%
150%
8%
Fragrances
4.1%
Chanel
4.5%
91%
2.5%
Step 4: Find out Market Growth rate
The overall growth rate in the Cosmetics Industry (as of 2018) = 4.8%
Step 5: Draw the circles on a matrix
How To Use A BCG Matrix?
Now that we have segregated the brands under four categories, let us see what strategies the company should use for each:
Stars
Products located in this quadrant are attractive as they are located in a robust category, and these products are highly competitive in the category. There is huge potential for high revenue growth since they have a high market share and a high growth rate. They may have been expensive to develop but are worth spending money on for promotion given the long extent of their product life cycle. If successful, a star will become a cash cow when the category matures (assuming they maintain its relative market share). Yet, not all stars become cash flows. This happens mainly in continuously changing industries, where even innovative products can be displaced by new technological advancements, so a star becomes a dog instead of a cash cow.
Most businesses start off as question marks. These require huge investments to capture or protect market share. Question marks have the potential to become stars and eventually cash cows but can also become dogs or exit. Investments should be high for question marks otherwise may produce negative cash flow.
Like stars, Question marks too may not always succeed, and if even after a large investment, they aren’t able to gain market share, they become dogs. Hence, careful consideration is required before investing in this category.
They generate profits by investing as little cash as possible in low-cost support and need to be managed for continued profits & cash flow. These are large corporates or SBUs that are efficient in innovation and have the potential to become stars. Cash cows need to maintain a strong market position and defend their market share. The company should take advantage of sales volume and leverage the size of its operations. Cash cows can also be used to support other businesses.
Due to low market share, these products face cost disadvantages so they may generate enough cash to break even, but they are rarely, if ever, worth investing in. Unless a dog has some other strategic aim, it should be liquidated if there are fewer prospects for it to gain market share (there is a low scale of economies: so difficult to make a profit). These are situated at a declining stage of the product life cycle. Therefore, the number of dogs in the company should be minimized. A company should optimize its current operations. It should get rid of all non-value-added activities and features. It must then reposition the offering to generate positive cash flow or sell this business.
Let us now see some advantages and limitations of using the BCG Matrix:
Advantages of BCG Matrix
It is simple and easy to understand.
It helps you to quickly and simply screen the opportunities open to you and helps you think about how you can make the most of them.
It is used to identify how corporate cash resources can best be used to maximize a company’s future growth and profitability.
The BCG Matrix produces a framework for allocating resources among different products and makes it possible to compare the product portfolio at a glance.
Limitations of BCG Matrix
BCG Matrix uses only two dimensions, relative market share and market growth rate. These are not the only indicators of profitability, attractiveness or success.
It neglects the effects of synergy between brands.
Businesses with a low market share can be profitable too.
High market share does not always lead to high profits since a high cost goes into getting a high market share.
At times, dogs may help the business or other products gain a competitive advantage.
The model neglects small competitors that have fast-growing market shares.
Go On, Tell Us What You Think!
Did we miss something? Come on! Tell us what you think about our article on BCG Matrixin the comments section.
Each week I share research backed AI oriented content in my newsletter.
There are AI ideas, AI trends, tutorials, and guides.
24k entrepreneurs read it. I'd love you to join.


")