

Most people still picture AI in education as a pilot program running in a handful of progressive school districts. Meanwhile, 86% of students have already built it into their daily coursework.
AI in education statistics from 2025 valued the market at $18.92 billion, with projections nearly tripling that figure by 2030. The gap between perception and adoption is wider than most educators realize.
The data shows which tools are gaining real traction, where adoption is concentrated, and whether student outcomes are keeping pace with the spending.
Key AI in Education Statistics
Student AI adoption jumped from 66% to 92% in a single year. These are the numbers that define where AI in education stands today.
- 92% of university students now use AI tools in some capacity, up from 66% in 2024 (HEPI/Kortext Student AI Survey 2025)
- 88% of university students used generative AI specifically for assessments in 2025, up from 53% in 2024
- 85% of teachers and 86% of students used AI in the preceding school year (Center for Democracy and Technology, 2025)
- 50% of educators express excitement about AI
- 93% of teachers want AI regulations established
- Students receiving guided AI-assisted learning achieved a 12.4% gain in English language skills and 23.1% gain in science scores
- Teachers who use AI tools at least weekly save an average of 5.9 hours per week, equivalent to roughly six weeks of reclaimed time across the school year (Gallup/Walton Family Foundation, 2025)
- The AI in education market is valued at USD 6.90 billion in 2025 and forecast to grow to USD 41.01 billion by 2030, reflecting a 42.83% CAGR (Mordor Intelligence)
- A 2025 Harvard University physics study found students using AI tutors learned more than twice as much in less time compared to traditional active-learning classrooms
- A 2026 meta-analysis synthesizing 58,702 participants found a mean effect size of 0.67 standard deviations for AI technologies on student learning outcomes (Journal of Educational Computing Research)
AI in Education Market Size and Growth Statistics
Research and Markets valued the AI in education market at $47.78 billion in early 2025. By February 2026, the same firm revised that estimate to $7.52 billion. A correction of that magnitude is not a data error. It is a signal that the definition of “AI in education” remains contested ground.
Research Firm | Base Valuation | Projected Value | CAGR |
|---|---|---|---|
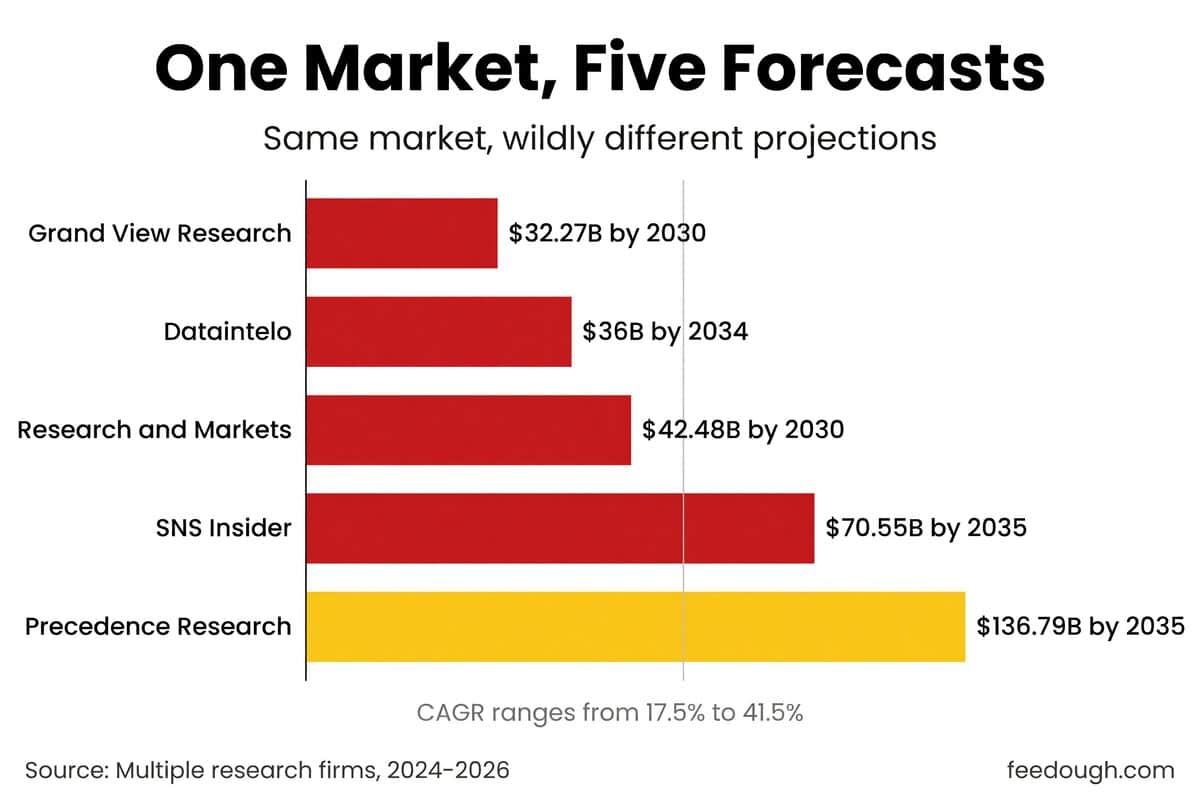
SNS Insider | $5.50B (2025) | $70.55B by 2035 | 29.07% |
Grand View Research | $5.88B (2024) | $32.27B by 2030 | 31.2% |
Research and Markets | $7.52B (2025) | $42.48B by 2030 | 41.5% |
Dataintelo | $8.4B (2025) | $36B by 2034 | 17.5% |
Precedence Research | $9.58B (2026) | $136.79B by 2035 | 34.52% |
The spread is not noise. Grand View Research counts narrowly: AI software licensed directly to schools and universities. Precedence Research and SNS Insider include adaptive learning platforms and AI tutoring systems that reach learners outside traditional institutions. Dataintelo takes the most conservative view, projecting a 17.5% CAGR while others exceed 30%. Every firm agrees the market is growing. None of them agree on what the market is.
AI in Education Market Valuation Range Statistics
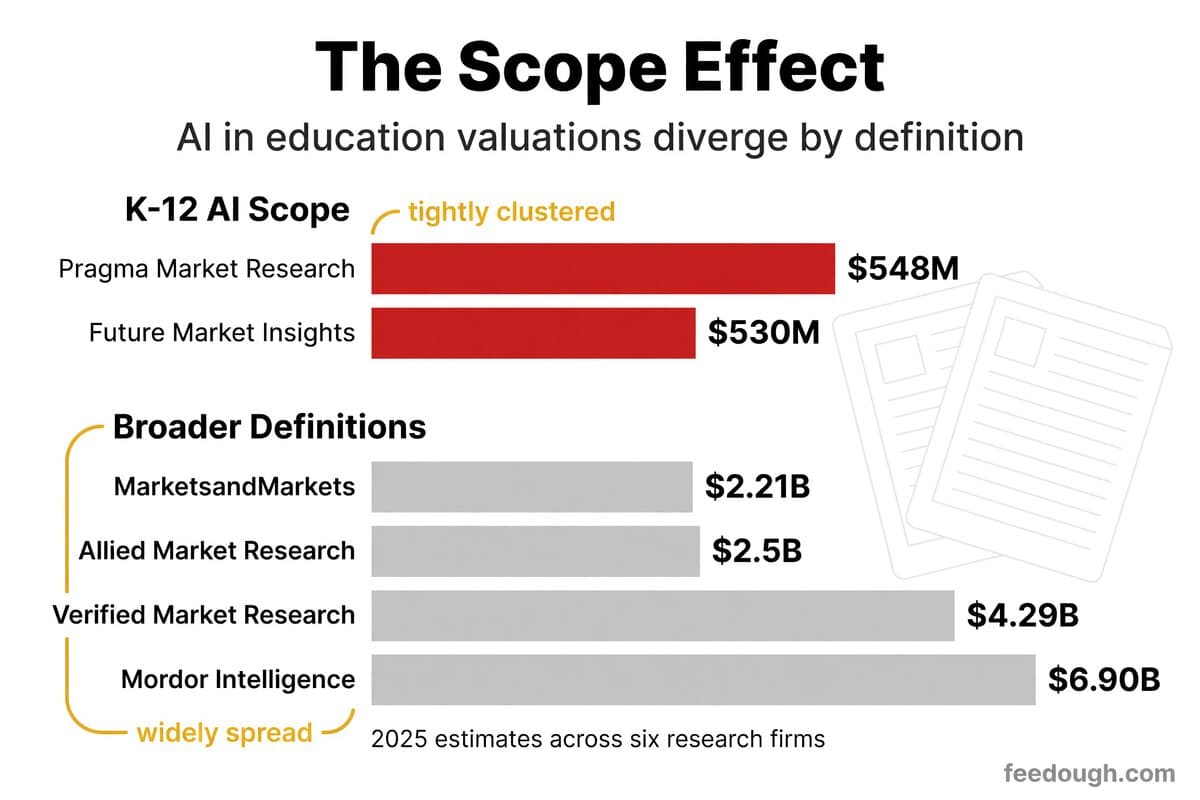
Most estimates of the AI in education market land between $5 billion and $48 billion for 2025. The spread narrows sharply once you filter by how each firm defines the market.
Research Firm | Market Scope | Base Valuation | Projected Value | CAGR |
|---|---|---|---|---|
Pragma Market Research | K-12 AI | $548M (2025) | $5.48B by 2032 | 39.5% |
Future Market Insights | K-12 AI | $530M (2025) | $18.47B by 2036 | 38.1% |
MarketsandMarkets | School-licensed AI | $2.21B (2024) | $5.82B by 2030 | 17.5% |
Allied Market Research | School-licensed AI | $2.5B (2022) | $6B by 2025 | N/A |
Verified Market Research | Broader education AI | $4.29B (2024) | $84.73B by 2032 | 45.21% |
Mordor Intelligence | Full market | $6.90B (2025) | $41.01B by 2030 | 42.83% |
The two K-12 valuations start within $18 million of each other despite different methodologies and projection windows. That consistency is the strongest signal here. Narrower scope produces tighter agreement, while broader definitions push both the floor and the ceiling further apart.
AI in Education CAGR and Growth Rate Statistics
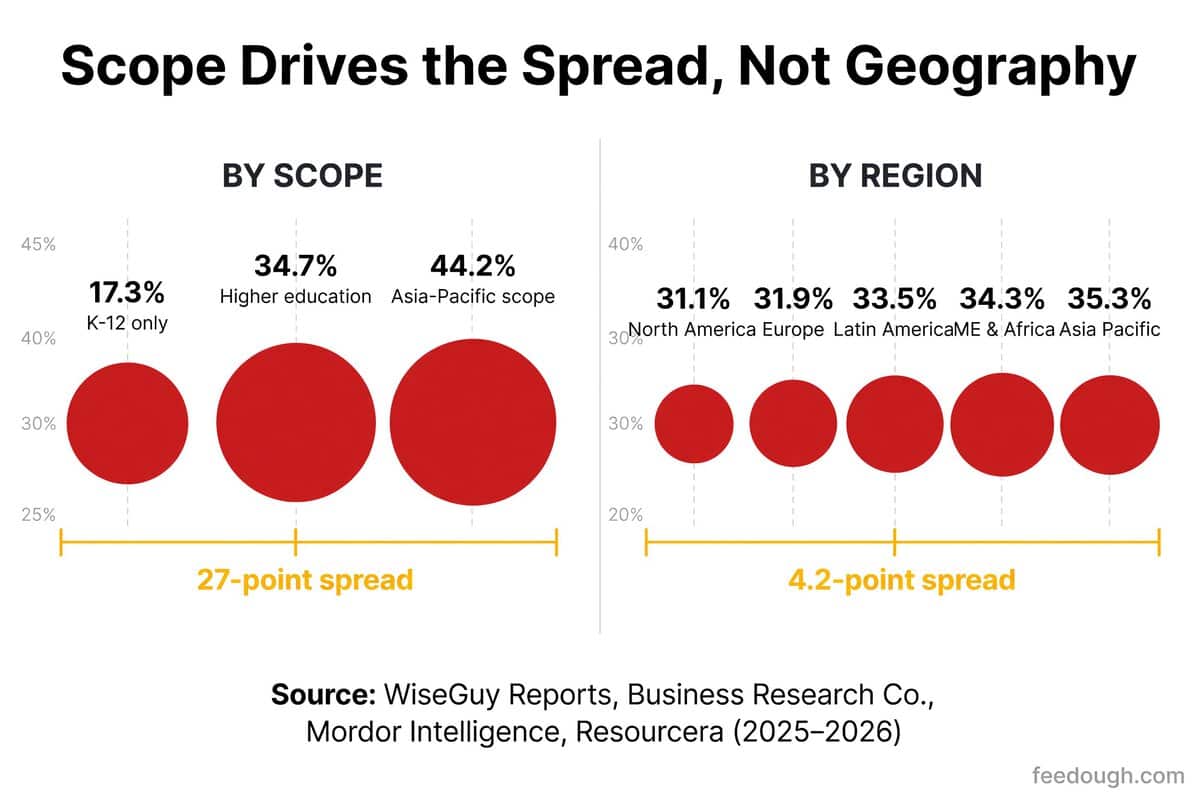
AI in education CAGR projections span from 17.3% to 44.2%, and every figure in that range holds up under scrutiny. The gap is not a sign of conflicting data. It is a direct product of what each research firm counts, where it counts, and how far ahead it projects.
Source | CAGR | Timeframe | Scope |
|---|---|---|---|
WiseGuy Reports | 17.3% | 2026-2035 | Narrow K-12 |
The Business Research Company | 34.7% | 2025-2030 | Higher education only |
Mordor Intelligence | 44.2% | 2025-2030 | Asia-Pacific |
Hold scope constant and compare regions, and the spread compresses. Resourcera’s 2026 regional analysis puts every major market within 4.2 points of each other:
- 31.1% CAGR in North America
- 31.9% CAGR in Europe
- 33.5% CAGR in Latin America
- 35.3% CAGR in Asia Pacific
- 34.3% CAGR in Middle East & Africa
Scope dwarfs geography as a growth-rate driver. The difference between counting only K-12 software and including all AI-powered learning tools is worth nearly 27 percentage points of CAGR.
AI in Education Long-term Market Projections Statistics
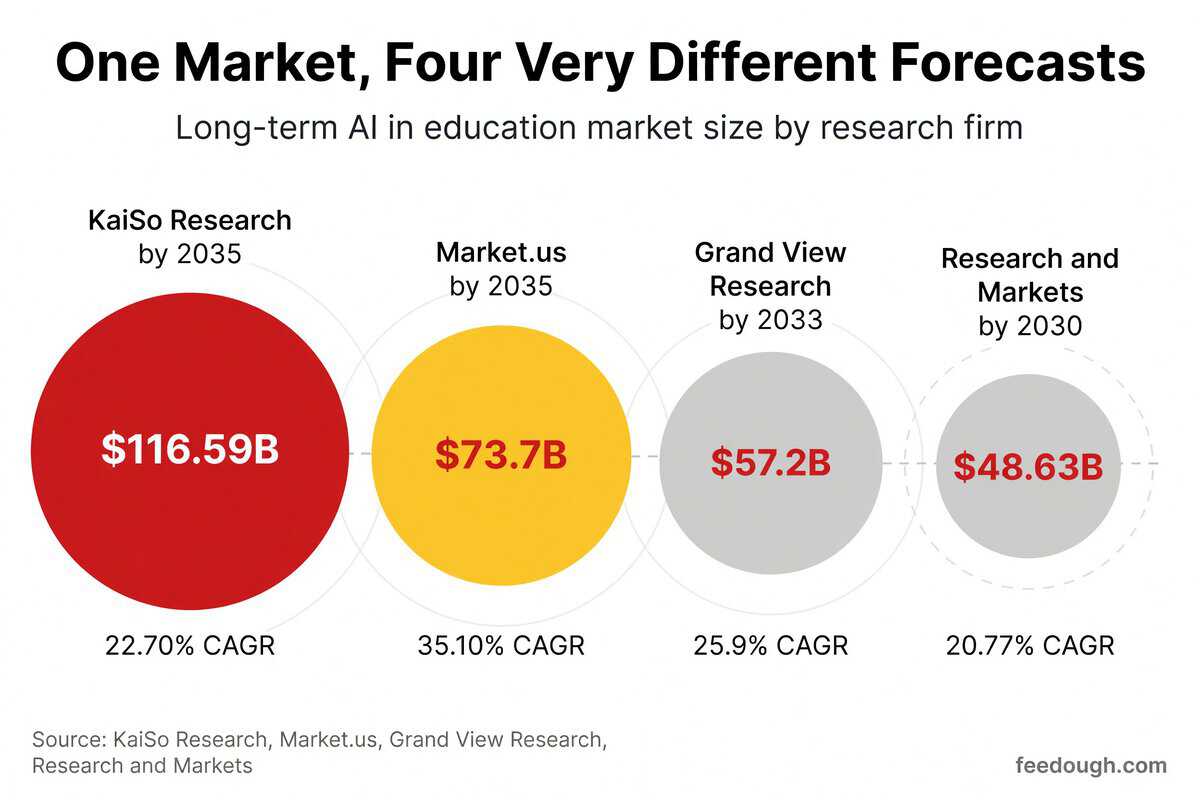
The widest long-term projection for AI in education reaches $116.59 billion. The most conservative global forecast for 2030 lands at $48.63 billion. Both trajectories point the same direction, but the gap between them reveals how much disagreement remains about pace and scope.
Research Firm | Base Valuation | Long-term Target | CAGR |
|---|---|---|---|
KaiSo Research | $5.88B (2024) | $116.59B by 2035 | 22.70% |
Market.us | Not reported | $73.7B by 2033 | 35.10% |
Grand View Research | Not reported | $57.2B by 2033 | 25.9% |
Research and Markets | $18.92B (2025) | $48.63B by 2030 | 20.77% |
Geography explains most of the divergence in these long-term projections. North America holds 37.5% of global spending and drives the near-term totals. Asia-Pacific, growing at 31.33% CAGR through 2035, is where the long-term ceiling is set.
Student and Teacher AI Adoption Statistics
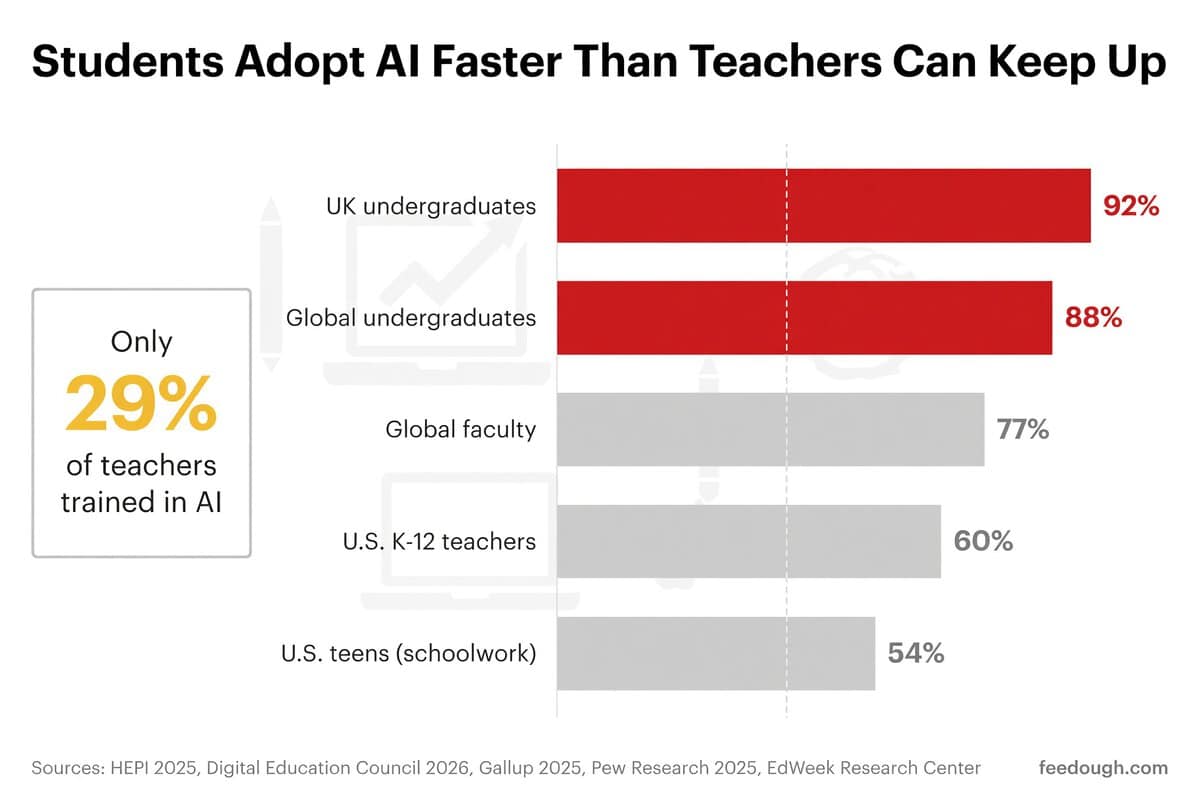
Student and teacher AI adoption rates diverge sharply. Only 29% of teachers have received formal training on AI, yet their students have already moved past the debate. A February 2026 JAMA Network Open study found that 32% of U.S. youths aged 4 to 17 have used generative AI apps, with adoption reaching 50% among teens aged 15 to 17.
Group | Adoption Rate | Change | Source |
|---|---|---|---|
UK undergraduates | 92% | +26 pp from 2024 | HEPI 2025 |
Global undergraduates | 88% | N/A | Digital Education Council 2026 |
Global faculty | 77% | +16 pp from 2025 | Digital Education Council 2026 |
U.S. K-12 teachers | 60% | N/A | Gallup/Walton Family Foundation 2025 |
U.S. teens (schoolwork) | 54% | More than doubled YoY | Pew Research Center 2025 |
Teacher AI training is scaling fast but started from almost nothing. Professional development on AI jumped from 13% to 50% between 2023 and 2025, and 74% of districts now offer some form of AI instruction. The question is whether institutional readiness catches up before student behavior outpaces classroom guidance.
Student AI Usage by Education Level Statistics
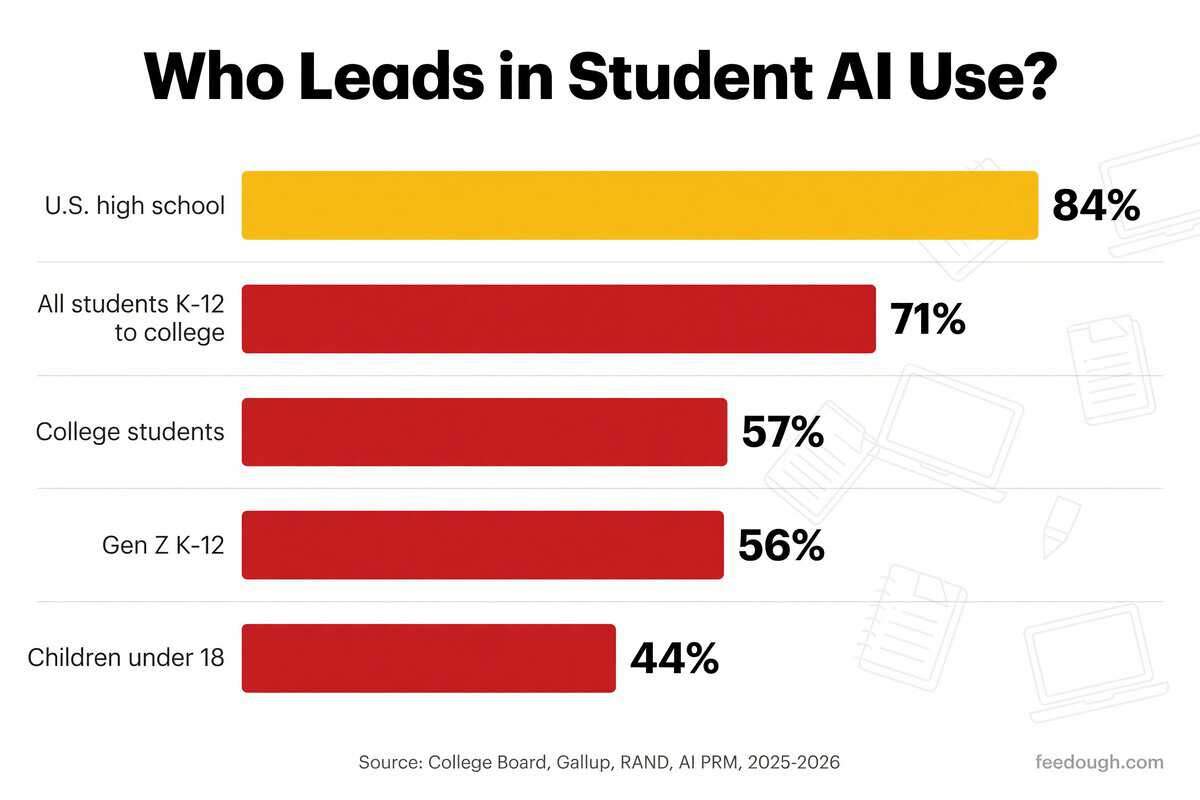
Most people picture college lecture halls when they think of student AI use. The data points to high school instead. College Board research from May 2025 found that 84% of U.S. high school students had used generative AI for schoolwork, with 69% turning to ChatGPT for homework.
Education Level | AI Usage Rate | Key Detail | Source |
|---|---|---|---|
U.S. high school students | 84% | 69% use ChatGPT for homework | College Board, May 2025 |
Gen Z K-12 students | 56% | Weekly AI usage | Gallup, 2026 |
U.S. college students | 57% | Weekly AI usage in coursework | Lumina Foundation-Gallup, 2026 |
All students (K-12 to college) | 71% | Used any AI tool for school | RAND, Dec 2025 |
Children under 18 | 44% | 54% of those for schoolwork | AI PRM, 2025 |
The 84% high school figure measures anyone who has ever tried AI. Weekly usage tells a tighter story: the gap between a high schooler and a college student is one percentage point.
- 56% of Gen Z K-12 students use AI at least weekly (Gallup, 2026)
- 57% of college students use AI weekly in coursework (Lumina Foundation-Gallup, 2026)
- 71% of students across all levels have used at least one AI tool for school-related activities (RAND, Dec 2025)
How Teachers Use AI by Task Statistics
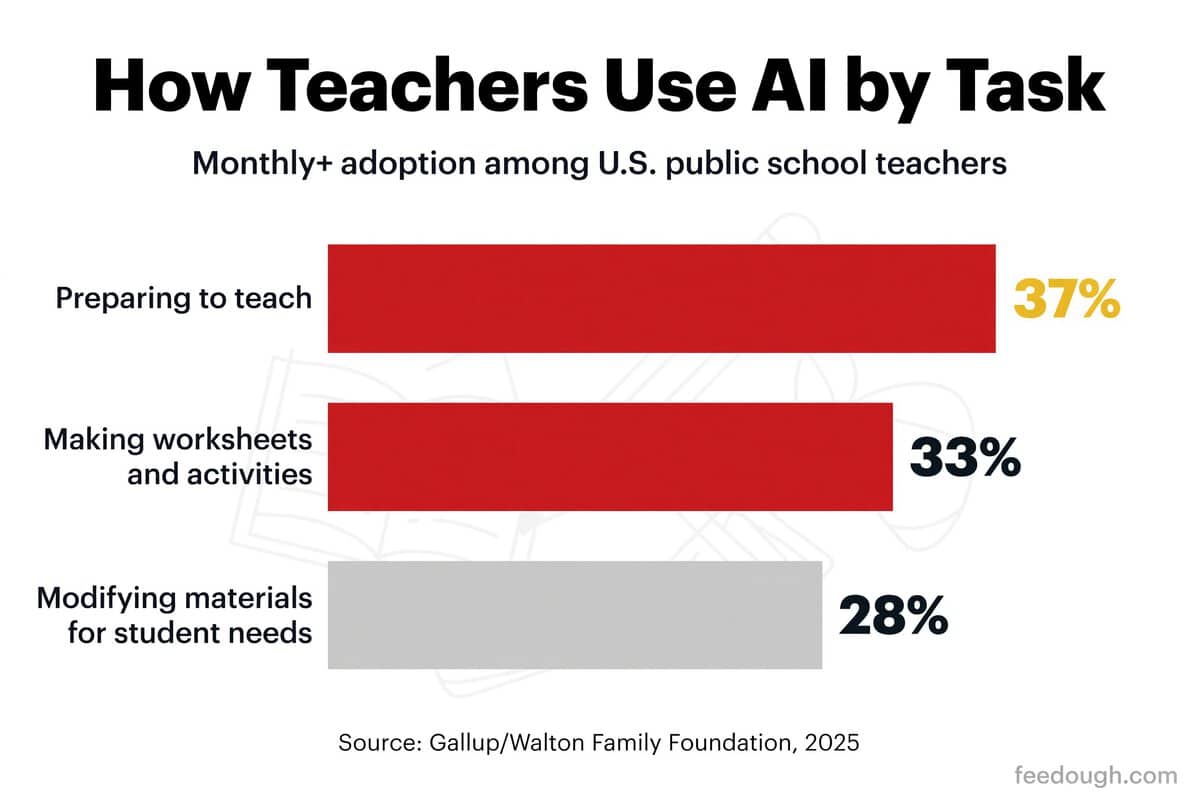
37% of teachers used AI to prepare lessons at least monthly in the 2024-25 school year, the highest adoption rate for any task measured. That still leaves nearly two-thirds of educators on the sidelines for the single area where AI has gained the most traction.
A Gallup/Walton Family Foundation study of 2,232 U.S. public school teachers tracked adoption across specific job functions. The results show a clear hierarchy: behind-the-scenes work gets AI first.
AI Task | Monthly+ Adoption | Source |
|---|---|---|
Preparing to teach | 37% | Gallup/Walton Family Foundation, 2025 |
Making worksheets and activities | 33% | Gallup/Walton Family Foundation, 2025 |
Modifying materials for student needs | 28% | Gallup/Walton Family Foundation, 2025 |
The adoption ceiling sits far below the comfort ceiling. 69% of teachers feel comfortable using AI for lesson planning and grading. Yet only about a third use it monthly or more for the most common task. Teachers who cross that threshold see returns. Weekly users reclaim roughly 5.9 hours per week, the equivalent of six weeks across the school year.
- 81% of monthly AI users say it saves time on administrative work
- 74% say AI improves the quality of their administrative output
- 52% report that AI tools reduce burnout
- 12% use AI tools daily, indicating habitual adoption remains rare (Youngstown State University, 2025)
Student and Teacher AI Use Case Statistics
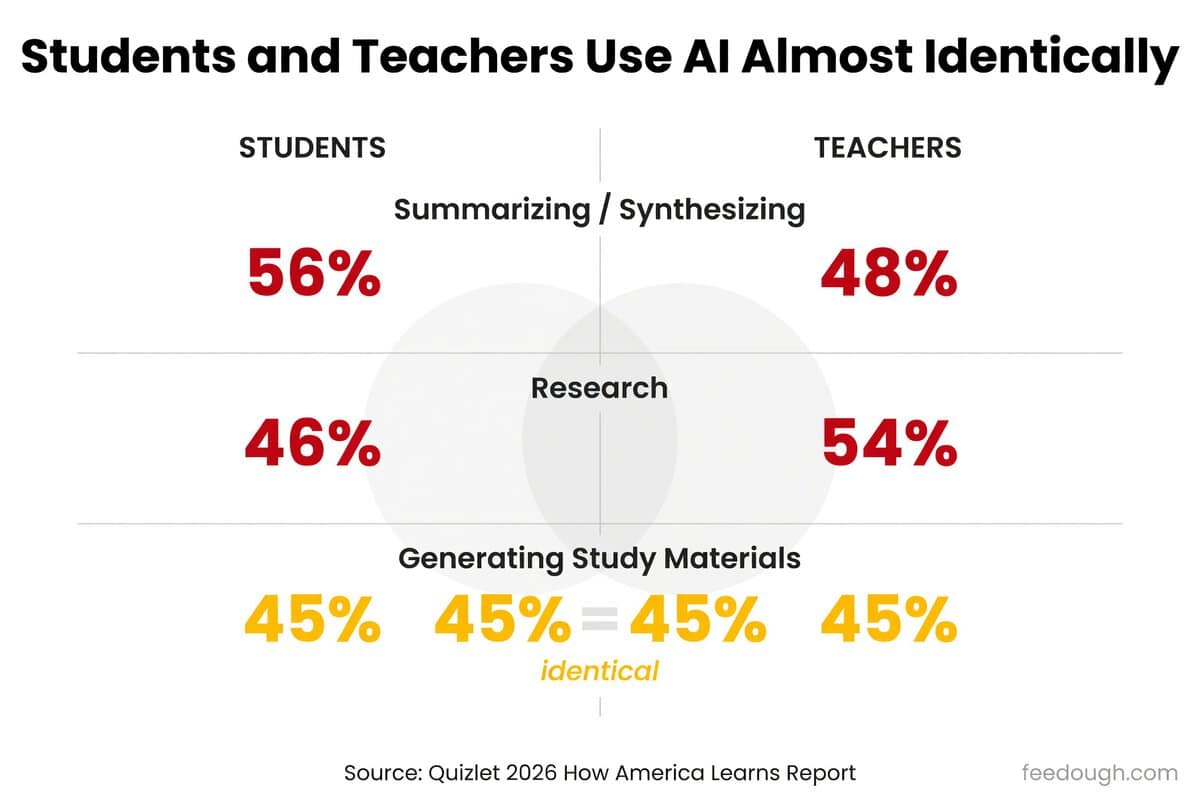
Students and teachers use AI for strikingly similar purposes. Quizlet’s 2026 How America Learns report found the gap between both groups stays within single digits across three of the highest-use categories. On one task, generating study materials, the adoption rate is identical: 45% for both.
AI Use Case | Students | Teachers | Source |
|---|---|---|---|
Summarizing/synthesizing | 56% | 48% | Quizlet 2026 |
Research | 46% | 54% | Quizlet 2026 |
Generating study materials | 45% | 45% | Quizlet 2026 |
Lesson plans and activities | — | 72% | RAND 2026 |
Brainstorming ideas | 41.8% | — | Michigan Virtual 2026 |
- 72% of teachers use AI for lesson plans and activities (RAND, January 2026, 4,200 K-12 teachers)
- 65% use it for worksheets and assessments (RAND, January 2026)
- 46% use it for rubrics and grading criteria (RAND, January 2026)
- 41.8% of students use AI for brainstorming ideas (Michigan Virtual, 2026)
- 37.8% use it for editing and clarity (Michigan Virtual, 2026)
- 29.2% use it for explaining concepts in different ways (Michigan Virtual, 2026)
The shared middle is where adoption is deepest. Microsoft Education’s 2025 report confirms the pattern from a different angle. Students cluster around summarizing (33%), quick answers (33%), and initial feedback (32%), with no single use case pulling away. Tools built for cross-role use are positioned for the strongest growth.
AI Education Performance and ROI Statistics
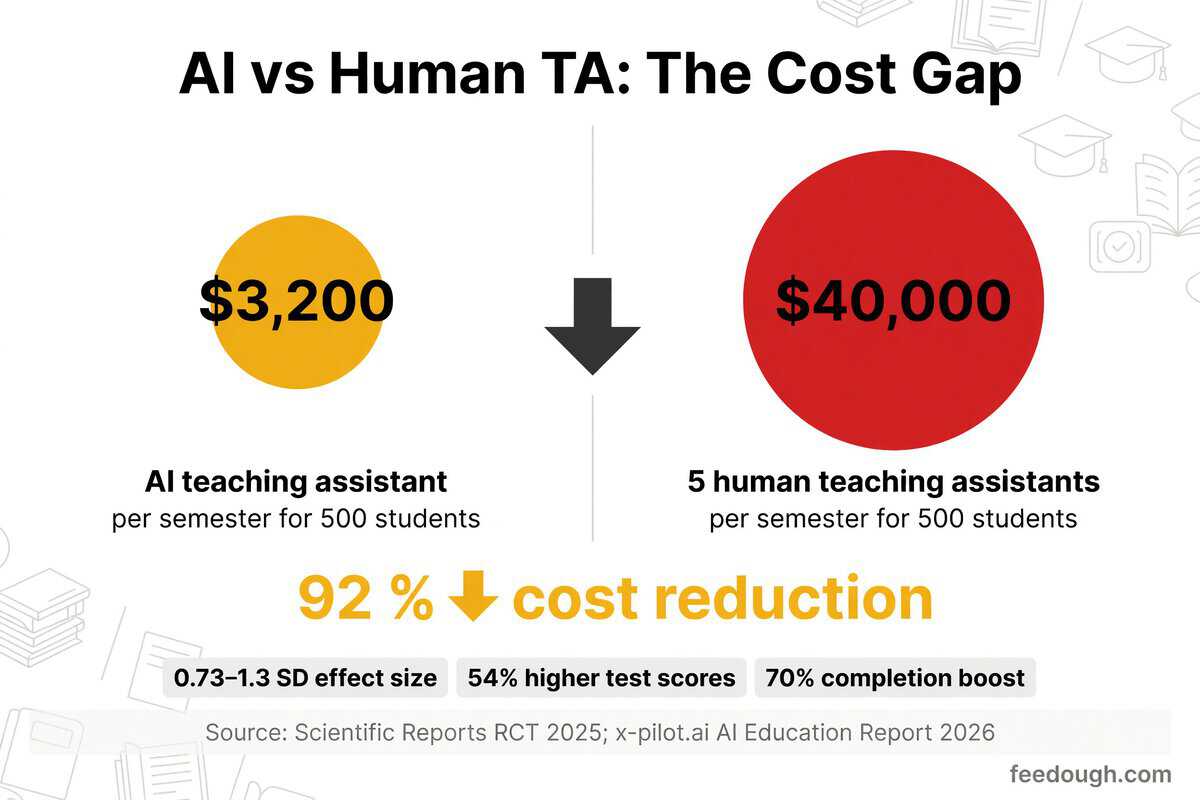
A June 2025 randomized controlled trial in Scientific Reports measured AI tutors against traditional classrooms. The effect sizes ranged from 0.73 to 1.3 standard deviations, and AI-group students finished tasks in 49 minutes versus 60. A Nature study found the same pattern: AI tutoring doubled median learning gains from active learning (p less than 10⁻⁸).
Study / Finding | AI Impact | Comparison |
|---|---|---|
Effect size (Scientific Reports RCT, 2025) | 0.73 to 1.3 SD | In-class learning |
Learning gains (Nature RCT) | Median more than double | Active learning (p < 10⁻⁸) |
Test scores in AI-enhanced environments | 54% higher | Traditional settings |
Exam score improvement (Macquarie University) | +10% | Non-AI control |
Topic mastery increase (Controlled studies) | 4 to 9 pp | Baseline |
Students reporting improvement (Coursera, 2026) | 80% | Self-reported |
The performance data settles the question of whether AI works. The cost data determines how fast it spreads. AI teaching assistant platforms cost roughly $3,200 per semester for a 500-student course, compared to $40,000 for five human teaching assistants. That 92% cost reduction explains the institutional rush.
AI personalization also boosts course completion by 70% and cuts dropout rates by 15%. Korea’s NEIS system demonstrates what national-scale deployment produces: over $200 million in annual savings across 12,000 schools. At the district level, the math is harder. Serving 5,000 students means annual AI tooling costs between $202,000 and $680,000, with per-student spending from $42 to $142. South Korea invested $740 million from 2024 to 2026 training teachers on AI tools, the largest government AI education investment relative to population globally.
AI in Education Academic Performance Statistics
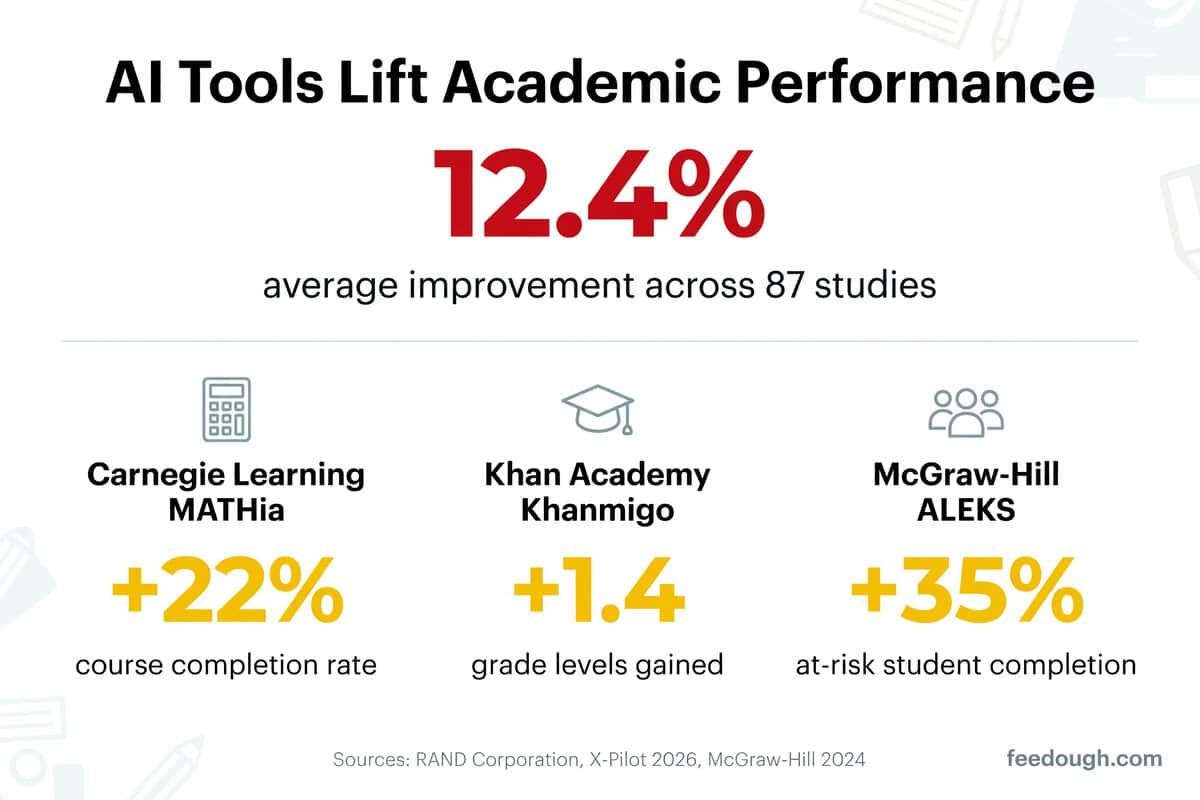
A meta-analysis of 87 educational studies measured a 12.4% average improvement in student performance when AI tools support learning. The gain held across subjects, grade levels, and tool types, shifting a typical class from a B- average to a B+. Controlled studies at the platform level now explain the mechanism behind that aggregate finding.
Platform / Program | Performance Metric | Result | Source |
|---|---|---|---|
Carnegie Learning MATHia | Course completion rate | 73% to 89% (+22%) | RAND Corporation / X-Pilot 2026 |
Carnegie Learning MATHia | Standardized test scores | 52nd to 67th percentile (+29%) | RAND Corporation / X-Pilot 2026 |
Carnegie Learning MATHia | Time to mastery | 38 to 27 hours (-29%) | RAND Corporation / X-Pilot 2026 |
Khan Academy Khanmigo | Grade-level improvement | +1.4 grade levels | X-Pilot 2026 |
McGraw-Hill ALEKS | Completion rate (at-risk students) | +35% vs. traditional | McGraw-Hill, 2024 |
Carnegie Learning’s MATHia results are the most granular: 87% of students rated its explanations equal to or better than a human tutor’s, and they attempted 3.2 times more practice problems per week than peers on traditional platforms. Students report higher motivation in personalized AI environments at a rate of 75%, compared with 30% in traditional classrooms. But the OECD Digital Education Outlook 2026 flagged a critical caveat: students using AI chatbots produced higher-quality outputs, yet that advantage often reversed in proctored exams when AI access was removed. Performing a task with AI does not automatically transfer to learning without it.
AI Impact on Teacher Efficiency Statistics
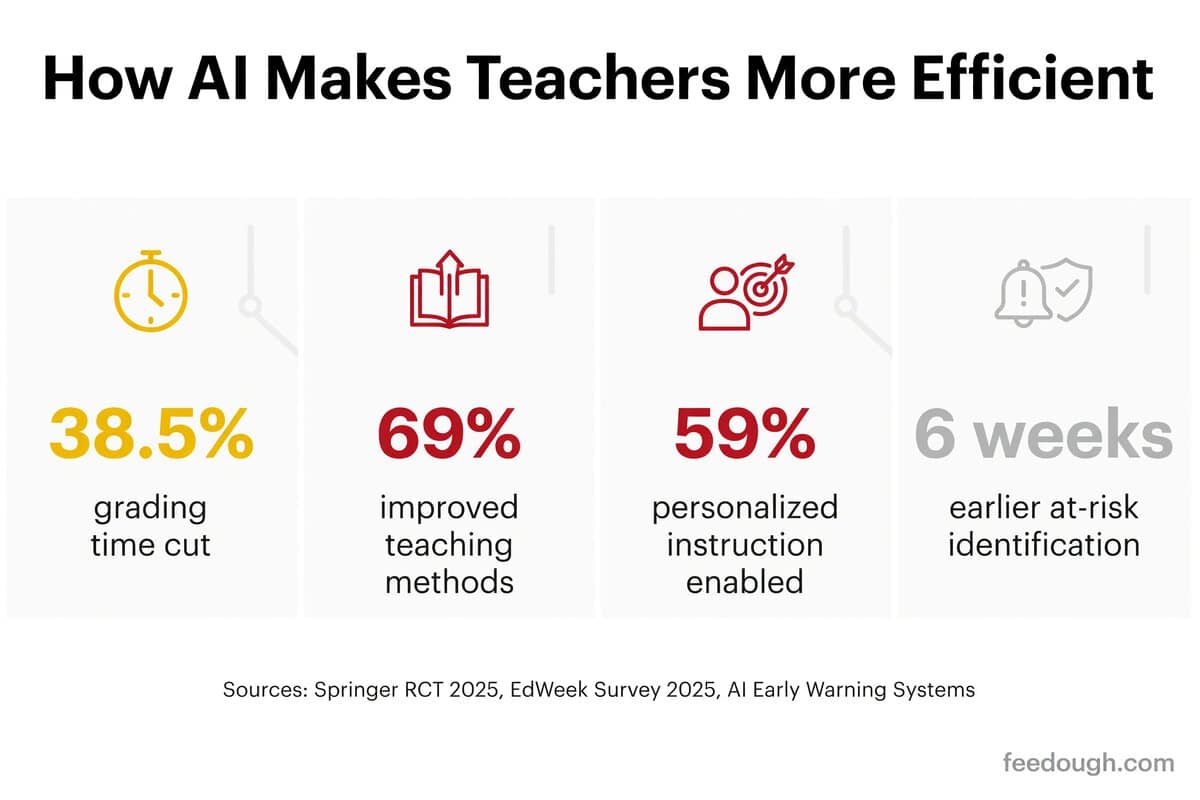
A peer-reviewed randomized controlled trial found that AI scoring systems cut teacher grading time by 38.5%. The control group using conventional methods saw just 5% reduction over the same period.
Teacher Efficiency Metric | Result | Source |
|---|---|---|
Grading time reduction (RCT) | 38.5% | Discover AI / Springer, 2025 |
Improved teaching methods | 69% of teachers | EdWeek, 2025 |
Enabled personalized instruction | 59% of teachers | EdWeek, 2025 |
Early at-risk student identification | 6 weeks before visible signs | AI early warning systems |
These AI teacher efficiency gains follow a consistent pattern. Grading automation is the entry point, measured and replicated in controlled settings. Survey data confirms the spillover extends further: teachers who reclaim administrative hours redirect that time toward personalized instruction. AI-powered early warning systems compound the effect, flagging struggling students an average of six weeks before traditional referrals would have identified them.
AI Corporate Training ROI Statistics
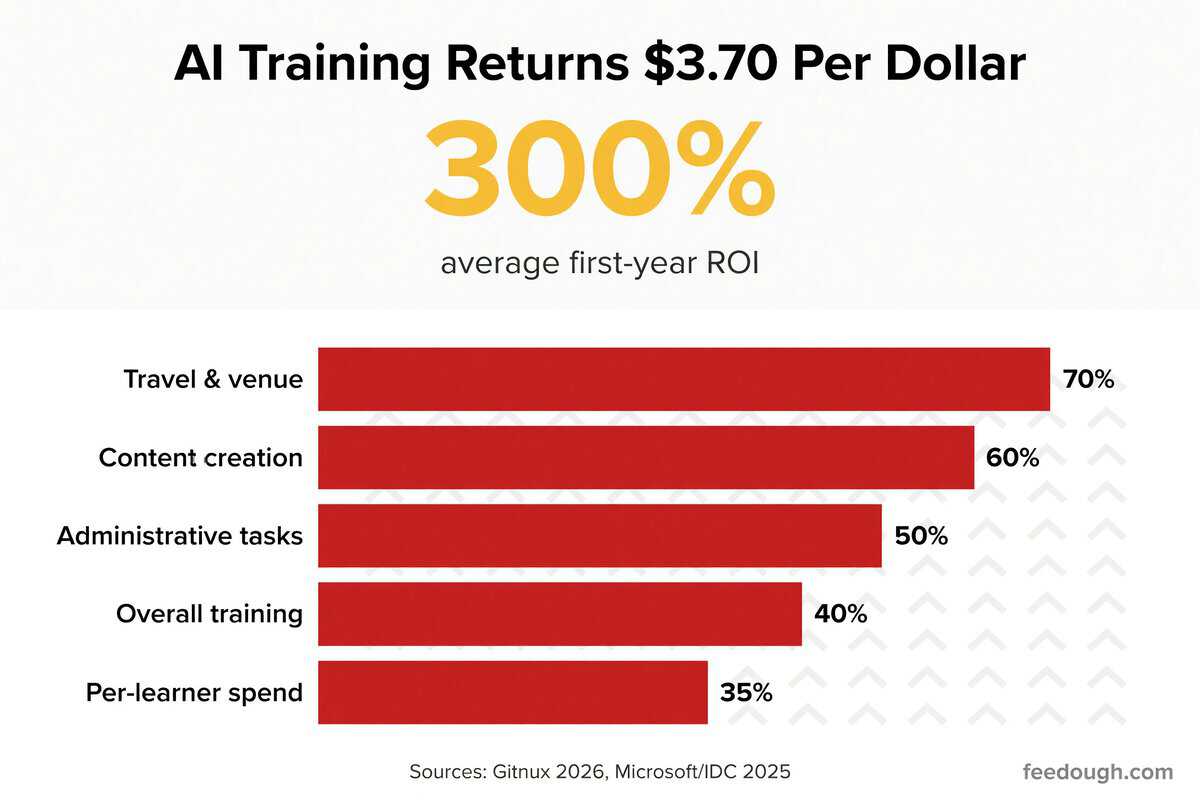
AI corporate training returns $3.70 for every dollar invested. Gitnux’s 2026 report puts the average first-year ROI at 300%, with gains concentrated across productivity, skill acquisition, and retention.
Metric | Result | Source |
|---|---|---|
First-year average ROI | 300% | Gitnux 2026 |
Return per dollar invested | $3.70 | Microsoft/IDC 2025 |
Productivity gain post-training | 57% | Gitnux 2026 |
Skill acquisition speed | 52% faster | Gitnux 2026 |
Employee retention improvement | 45% | Gitnux 2026 |
The cost reductions driving those returns span every major training expense line.
- 70% reduction in travel and venue expenses
- 60% drop in content creation costs
- 50% savings on administrative tasks
- 40% reduction in overall training costs
- 35% decrease in per-learner spending
Future of AI in Education: Policy Gaps, Equity, and Readiness Statistics
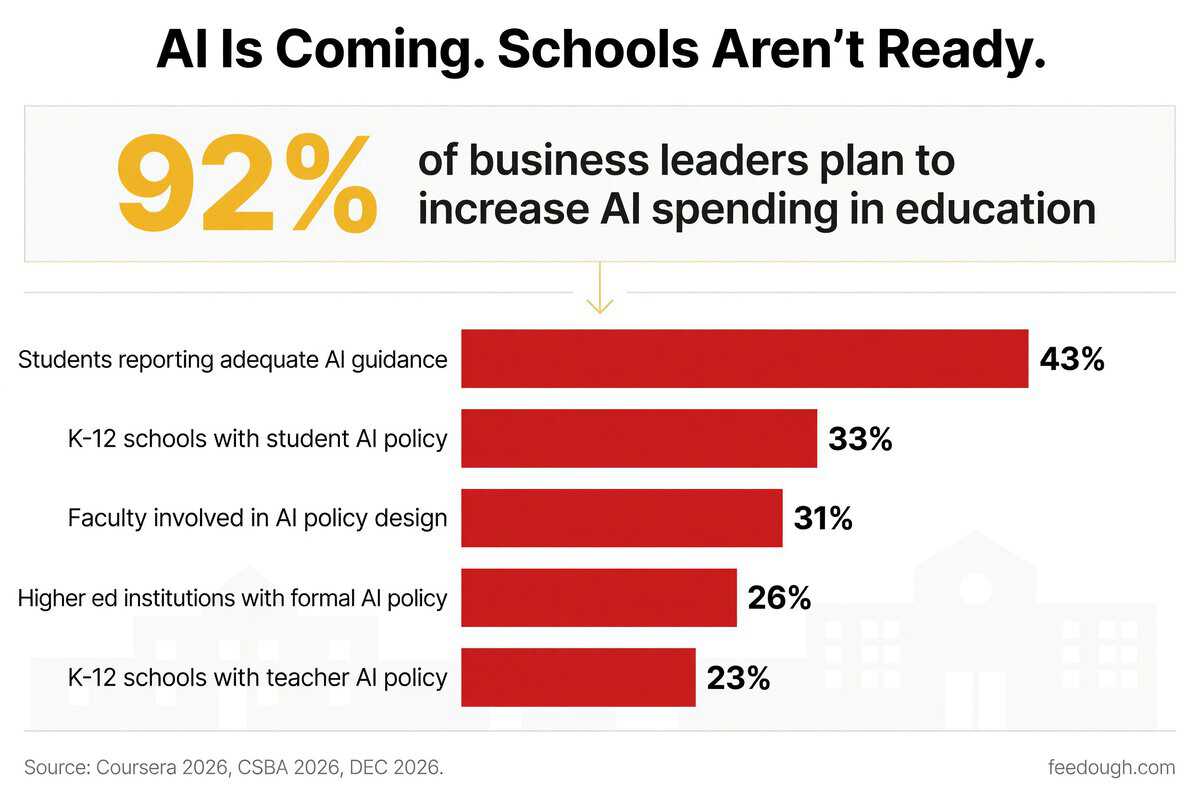
92% of business leaders plan to increase AI spending in education, yet only 26% of higher education institutions have a formal AI policy. The organizations funding deployment are outpacing the institutions expected to govern it.
Readiness Metric | Current Rate | Source |
|---|---|---|
Higher ed institutions with formal AI policy | 26% | Coursera, 2026 |
K-12 schools with student AI use policy | 33% | CSBA, 2026 |
K-12 schools with teacher AI use policy | 23% | CSBA, 2026 |
Faculty involved in AI policy design | 31% | DEC, 2026 |
Students reporting adequate AI guidance | 43% | DEC, 2026 |
U.S. states with AI legislation introduced | 50 + DC | NCSL, 2025 |
Teachers are demanding rules that have not arrived. 93% of them want AI regulations, and all 50 states plus D.C. and two territories have introduced AI-related bills. But generic legislation does not address classroom governance. A Pew Research Center survey found that 58% of adults worry the government will not regulate AI aggressively enough. Teachers themselves are split: 25% expect classroom AI to produce net benefits, while 32% anticipate equal harm and benefit. The educators closest to the technology express the most uncertainty about its trajectory.
The equity gap turns that uncertainty into a structural risk. 43% of adults in households earning under $30,000 lack home broadband access. In May 2025, the U.S. Senate voted to repeal FCC rules that allowed E-Rate funds to cover off-campus Wi-Fi hotspots. The decision threatened $27.5 million in connectivity funding sought by more than 20,000 schools and libraries. AI learning tools run on connected devices. If adoption accelerates without closing the access gap, the students who stand to gain most from personalized instruction will be the last to reach it. Nearly 7 in 10 learners now report AI is part of their coursework. Formal institutional training has risen more than 20 percentage points in a year. The demand side is not waiting for policy to catch up.
Sources
- https://acequiz.ai/blog/ai-in-education-statistics (2026)
- https://www.demandsage.com/ai-in-education-statistics (2026-06-02)
- https://www.facultyfocus.com/articles/teaching-with-technology-articles/designing-the-2026-classroom-emerging-learning-trends-in-an-ai-powered-education-system (2025-10-01)
- https://schoolai.com/blog/strategies-how-to-boost-teacher-productivity-reduce-workload-with-ai (2025)
- https://www.mordorintelligence.com/industry-reports/ai-in-education-market (2025)
- https://www.morso.app/blog/how-ai-is-changing-education (2025)
- https://finance.yahoo.com/news/ai-education-market-size-surpass-13679-billion-2035-amid-rapid-edtech-expansion-ai-adoption (2026-02-25)
- https://www.researchandmarkets.com/reports/5896034/ai-in-education-market-report (2026-02-01)
- https://www.snsinsider.com/reports/ai-in-education-market-8289 (2025)
- https://dataintelo.com/report/ai-in-education-market (2026-05-17)
- https://www.x-pilot.ai/blog/future-ai-education-2026-trends-report (2026)
- https://www.futuremarketinsights.com/reports/ai-in-k-12-education-market (2026)
- https://www.pragmamarketresearch.com/market-research/ai-in-k12-education-market.html (2026-06-23)
- https://www.didask.com/en/post/marche-e-learning (2025)
- https://resourcera.com/data/artificial-intelligence/ai-in-education-statistics (2026)
- https://www.einpresswire.com/article/898447345/artificial-intelligence-ai-market-in-higher-education-is-projected-to-grow-to-13-46-billion-by-2030-at-a-34-7-cagr (2026)
- https://www.grandviewresearch.com/industry-analysis/artificial-intelligence-ai-education-market-report (2026-06-08)
- https://market.us/report/ai-in-education-market (2026)
- https://www.kaisoresearch.com/report-store/global-ai-in-education-market (2025-12-03)
- https://finance.yahoo.com/sectors/technology/articles/ai-education-market-size-grow-143000216.html (2026-05-22)
- https://www.edtechinnovationhub.com/news/q6zw9wco2mttajdbd1jyeonjnpiovu (2026)
- https://www.pewresearch.org/internet/2026/02/24/how-teens-use-and-view-ai (2025-12-09)
- https://www.thirdrocktechkno.com/blog/how-ai-is-reshaping-the-future-of-k-12-and-higher-education-in-the-usa (2025)
- https://www.forbes.com/sites/sarahhernholm/article/will-ai-replace-teaching-jobs (2026)
- https://programs.com/resources/ai-education-statistics (2025)
- https://www.digitaleducationcouncil.com/dec-insights/92-of-students-and-79-of-faculty-actively-engaging-with-ai-findings-from-ai-in-higher-education-latam-survey-2026 (2026-02-06)
- https://news.gallup.com/poll/704090/routine-college-students-despite-campus-limits.aspx (2025)
- https://news.gallup.com/poll/708224/gen-adoption-steady-skepticism-climbs.aspx (2026)
- https://www.rand.org/news/press/2026/03/student-use-of-ai-for-homework-rises-as-concerns-grow.html (2026-03-17)
- https://news.gallup.com/poll/691967/three-teachers-weekly-saving-six-weeks-year.aspx (2025)
- https://www.oecd.org/content/dam/oecd/en/publications/reports/2026/01/oecd-digital-education-outlook-2026_940e0dd8/062a7394-en.pdf (2026-01)
- https://online.ysu.edu/degrees/education/msed/teacher-ai-usage-statistics (2026-01-05)
- https://passivesecrets.com/ai-in-education-statistics (2026)
- https://michiganvirtual.org/research/publications/ai-in-education-perceptions-around-use-disclosure-and-guidance (2026-05-22)
- https://www.aimagicx.com/blog/ai-education-teachers-perspective-classroom-2026 (2026-01)
- https://www.engageli.com/blog/ai-in-education-statistics (2026-02-01)
- https://aibusinessweekly.net/p/ai-education-statistics (2025-06-01)
- https://www.notieai.com/ai-in-education-statistics (2026-01-15)
- https://gitnux.org/ai-in-the-corporate-training-industry-statistics (2026-07-18)
- https://iternal.ai/ai-training-roi (2025)
- https://www.coursera.org/enterprise/articles/ai-in-higher-education-guidance-for-university-leaders-2026-cm (2026)
- https://blog.csba.org/ai-and-educators (2026-07-17)
- https://etcjournal.com/2026/06/02/ai-and-the-promise-of-educational-equity (2026-06-02)
- https://www.jff.org/newsroom/press-releases/ai-usage-in-education-is-growing-but-gaps-in-guidance-persist-new-survey-finds (2026-03-18)