
TikTok took four years to reach 800 million users. Facebook needed eight. ChatGPT did it in roughly three. The gap between what most people expected and what actually happened is where this data lives.
ChatGPT statistics from 2025 put its weekly active user base at 800 million as of September. That represents nearly 10% of the world’s adult population using an AI tool every single week, a level of adoption with no historical precedent.
Here is what the numbers reveal about how fast this is happening, what is driving it, and where the growth is headed next.
Key ChatGPT Statistics
ChatGPT’s trajectory in 2025 erased every assumption about how fast a technology platform can scale. Here are the numbers that define where it stands today.
- 800 million weekly active users as of September 2025
- Doubled from 400 million to 800 million in just 7 months (Feb–Sept 2025)
- Growing by about 57 million new weekly users per month
- Targeting 1 billion weekly active users by end of 2025
- $12 billion annual recurring revenue (ARR) by July 2025
- Monthly revenue grew from $500 million in January 2025 to $1 billion in July 2025
- 15.5 million ChatGPT Plus subscribers ($20/month) as of end of 2024
- 1.5 million enterprise customers as of March 2025
- 64.26 million app downloads in March 2025 (one month)
- 318 million downloads in 2025 so far (2.8x increase year-over-year)
- $1.35 billion in consumer spending in 2025
- Average revenue per download: $2.91 globally, $10 in the U.S.
- Gender: 64% male, 36% female (female share rose to 52% by mid-2025)
- Age: 45% under 25; 54% between 18–34
- Geography: U.S. 19% of users, India 7%, Brazil 5%
- India leads in daily usage intensity (36% vs global avg. 17%)
- Denmark: 56.5% monthly usage, 15.2% daily
- Japan: 57.2% monthly usage, 7.1% daily (lowest globally)
- 1.5 million enterprise users as of March 2025 (10x growth year-over-year)
- 92% of Fortune 500 companies use OpenAI products
- Industry adoption rates: Marketing professionals 65%, Journalists 64%, Developers 63%
- 61% of companies globally use ChatGPT for writing tasks
ChatGPT User Growth and Scale Statistics
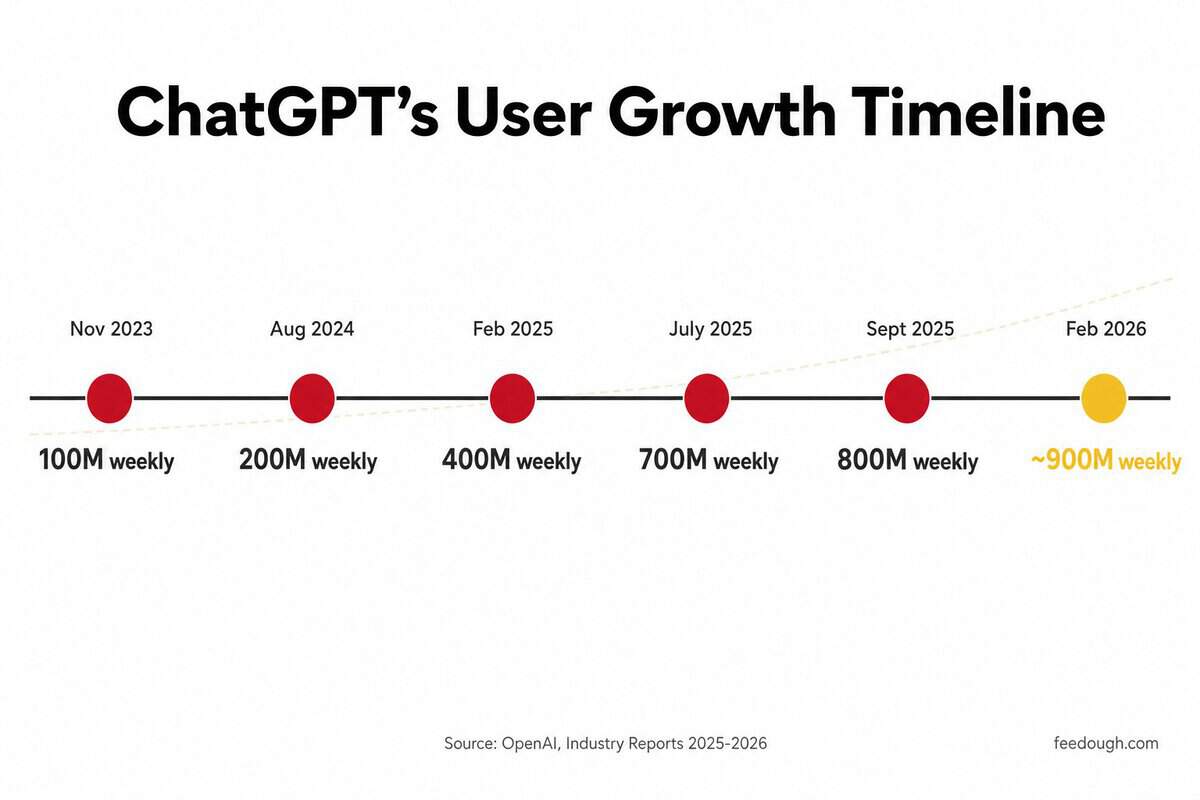
ChatGPT reached 800 million weekly active users by September 2025. That milestone arrived roughly three years after launch, making it the fastest-growing technology platform in history by a wide margin.
Milestone | Date | Time to Reach |
|---|---|---|
100 million monthly active users | January 2023 | 2 months |
100 million weekly active users | November 2023 | 12 months |
200 million weekly active users | August 2024 | 9 months |
400 million weekly active users | February 2025 | 6 months |
700 million weekly active users | July 2025 | 5 months |
800 million weekly active users | September 2025 | 2 months |
The acceleration is visible in every interval. Each new 100-million-user tranche took less time than the one before it. Users now send roughly 18 billion messages per week on the platform, with about 2.5 billion prompts per day. OpenAI originally targeted 1 billion weekly active users by the end of 2025. It missed that mark, reaching approximately 900 million weekly active users by February 2026. Even when the world’s fastest-growing platform falls short of its own goals, it still adds users at a pace no other product has matched.
ChatGPT Revenue and Monetisation Statistics
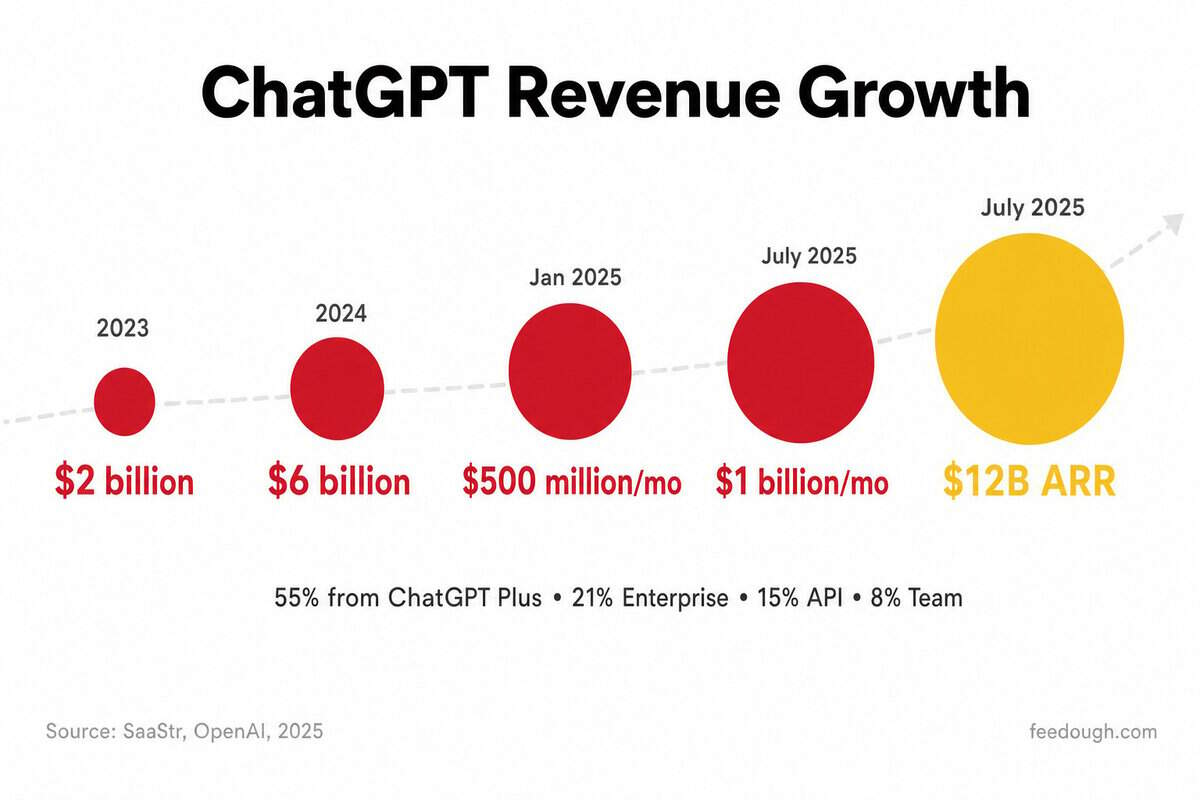
OpenAI hit $12 billion in annual recurring revenue by July 2025. That milestone took roughly 30 months from launch. Most enterprise software companies take a decade to reach that number, if they reach it at all.
Period | Revenue | Growth |
|---|---|---|
2023 (annualized) | $2 billion | Baseline |
2024 (ARR) | $6 billion | 3x from 2023 |
Jan 2025 (monthly) | $500 million | – |
July 2025 (monthly) | $1 billion | 2x in 7 months |
July 2025 (ARR) | $12 billion | 2x from 2024 |
The revenue comes from four distinct channels. ChatGPT Plus subscriptions dominate today, but enterprise is accelerating faster. Here is the breakdown by source:
- 55% from ChatGPT Plus subscriptions (grew from 15.5 million subscribers at end of 2024 to 20 million by April 2025)
- 21% from Enterprise customers (1 million+ business customers as of November 2025)
- 15% from API access for developers and third-party integrations
- 8% from Team subscriptions for smaller business groups
The consumer side leads today, but the mix is shifting. Enterprise revenue represented over 40% of OpenAI’s total by early 2026 and is on track to reach parity with consumer subscriptions by the end of that year. Individual users adopted ChatGPT first. Organizations are integrating it into core workflows, and those contracts carry higher values and lower churn rates than consumer subscriptions ever could.
ChatGPT Mobile App Performance Statistics
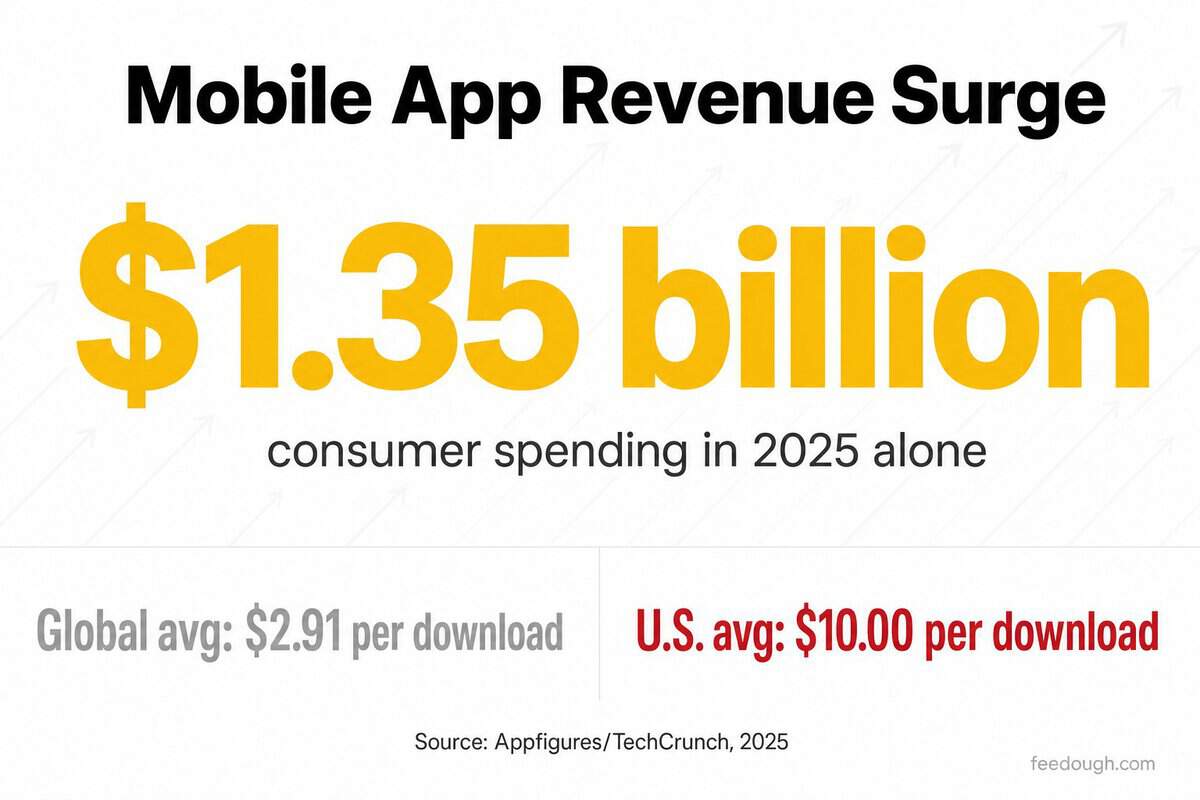
ChatGPT’s mobile app generated $1.35 billion in consumer spending in 2025 alone. That is a 673% year-over-year increase, and it pushed the app’s lifetime consumer spending past $2 billion since launch.
Metric | Value | Period |
|---|---|---|
Monthly downloads (peak) | 64.26 million | March 2025 |
Total downloads (Jan–Aug 2025) | 318 million | First 8 months of 2025 |
Download growth (YoY) | 2.8x increase | 2025 vs 2024 |
Consumer spending (lifetime) | $2 billion | Since launch |
Consumer spending (2025 only) | $1.35 billion | 2025 |
Daily active users | ~123.5 million | 2025 |
The monetization is where the mobile story gets sharper. Revenue per download varies dramatically by market. Here is the breakdown:
- Global average: $2.91 per download
- United States: $10.00 per download (3.4x the global average)
The U.S. figure reflects a market where paid subscriptions convert at higher rates and users are more accustomed to paying for software. That $7 gap per download between the U.S. and the rest of the world explains why geographic expansion is not OpenAI’s only growth lever. Increasing U.S. market penetration alone produces outsized returns compared to acquiring users in lower-ARPDAU regions.
ChatGPT App Store Rankings and Download Statistics
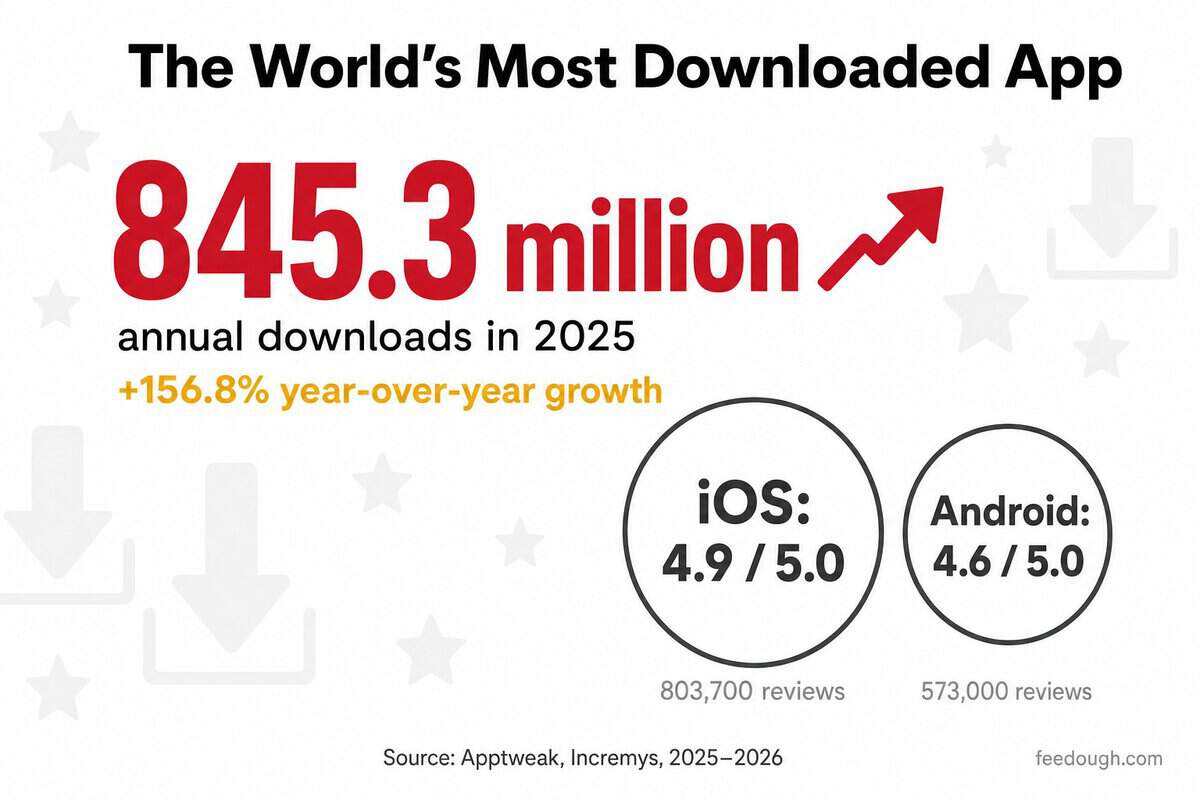
ChatGPT was the most downloaded app globally in 2025 with 845.3 million downloads. That total represents a 156.8% year-over-year increase and makes ChatGPT the first non-social app ever to rank as the #1 most downloaded app in the world.
Ranking Metric | Value | Year |
|---|---|---|
Global ranking (all apps) | #1 most downloaded | 2025 |
Total annual downloads | 845.3 million | 2025 |
Year-over-year growth | +156.8% | 2025 vs 2024 |
iOS App Store rating | 4.9 / 5.0 | 2026 |
iOS total reviews | 803,700 | 2026 |
Google Play rating | 4.6 / 5.0 | 2026 |
Google Play total reviews | 573,000 | 2026 |
The ratings data is worth pausing on. A 4.9 rating on iOS based on 803,700 reviews is not common for any app, let alone one that added 845 million downloads in a single year. The combination of massive scale and high satisfaction suggests ChatGPT is solving a problem people genuinely value, not one they try and abandon. The #1 global ranking ended a years-long streak of social apps dominating the top spot. TikTok, Instagram, and Facebook had held those positions since before ChatGPT existed.
ChatGPT Mobile Usage Patterns and Engagement Statistics
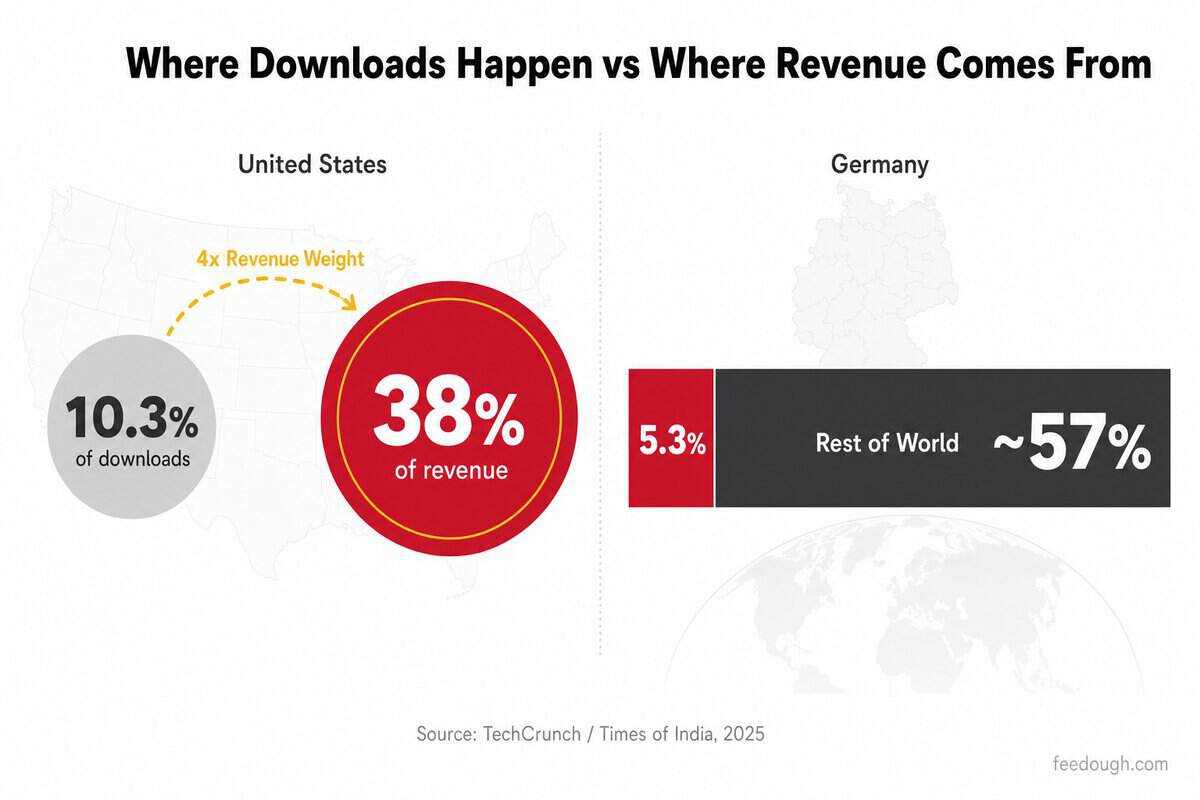
Mobile downloads surged 180% to 45 million per month in 2025. But the download numbers alone miss half the story. Where those downloads happen and how much each market spends reveals a sharply uneven engagement pattern.
Market | Share of Downloads | Share of Revenue |
|---|---|---|
United States | 10.3% | 38% |
Germany | – | 5.3% |
Rest of world | ~90% | ~57% |
The U.S. delivers nearly four times its download weight in revenue. That kind of conversion efficiency is rare in consumer apps and explains why OpenAI’s mobile monetization strategy does not need to prioritize volume growth above all else. The app averaged roughly $193 million in monthly revenue in 2025, up from $25 million per month the year before. Those gains came mostly from converting existing users, not acquiring new ones at a faster rate.
ChatGPT User Demographics and Behaviour Statistics
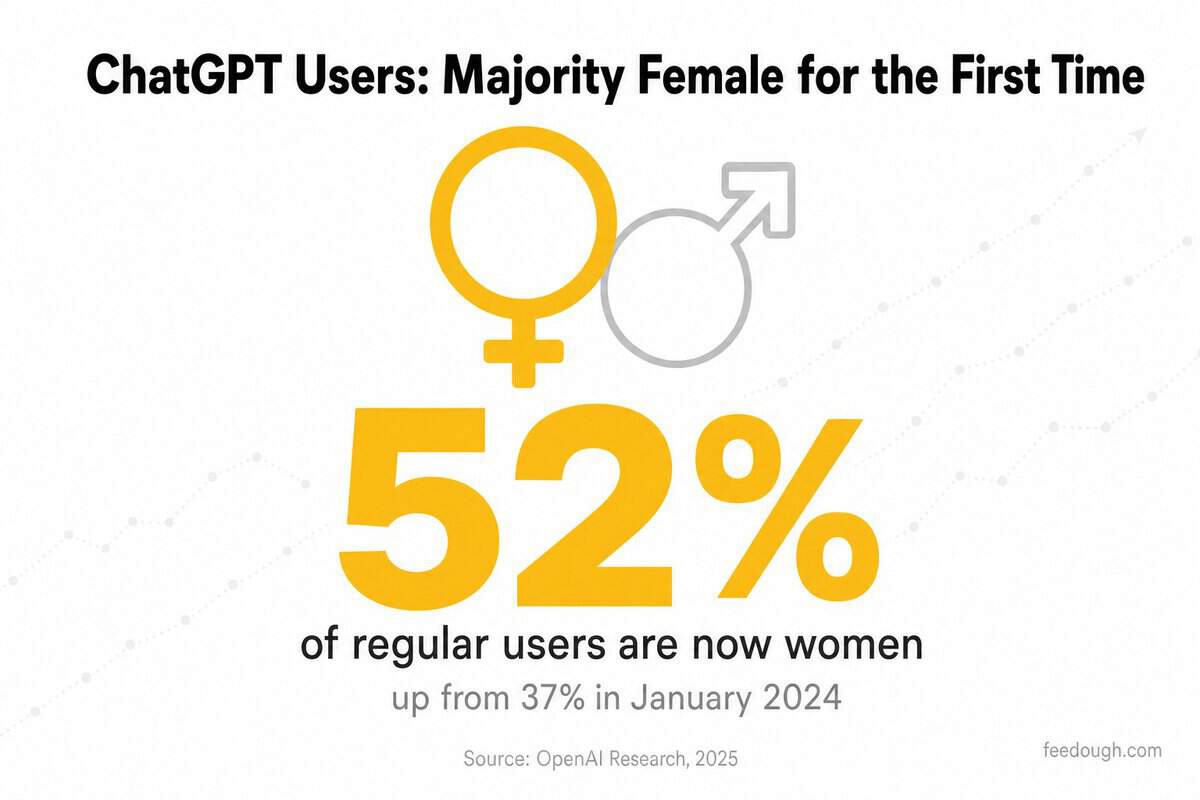
Most people still picture the typical ChatGPT user as a young male developer. The data from 2025 tells a different story. 52% of regular users are now women, up from just 37% in January 2024. The gender adoption gap closed in roughly 18 months.
Demographic | Share | Detail |
|---|---|---|
Female users | 52% | Up from 37% in Jan 2024 |
Ages 18–34 | 54–56% | 25–34 is largest cohort at 29.67% |
Under 25 | ~45% | Drive the highest message volume |
Over 65 | 5.23% | Smallest but growing age group |
Global daily active users | ~198.8 million | As of February 2026 |
The age skew is younger than most social platforms, but not dramatically so. Users aged 18 to 34 make up just over half the base. Users 45 and older account for more than a quarter. The geography of engagement tells a sharper story. Daily usage rates vary by country, reflecting how deeply AI tools have embedded into daily life in different markets.
- The United States leads in total users with 19.01% of the global base, followed by India at 7.86% and Brazil at 5.05%
- Denmark has the highest daily engagement at 15.2% of users active daily
- Japan reports the lowest daily usage at 7.1%, despite 57.2% monthly usage
- India leads in usage intensity with 36% daily engagement vs a global average of 17%
Those gaps are not random. Markets with mobile-first cultures and younger median ages show higher daily stickiness. Japan’s pattern (high monthly trial, low daily retention) suggests occasional rather than habitual use. India’s opposite pattern confirms the tool has found daily utility there. The broader demographic shift toward female users tracks with OpenAI’s own research. Usage has moved from work tasks toward personal guidance, creative projects, and everyday problem-solving, a change that naturally broadens the user base beyond its original early-adopter profile.
ChatGPT Age and Gender Demographics Statistics
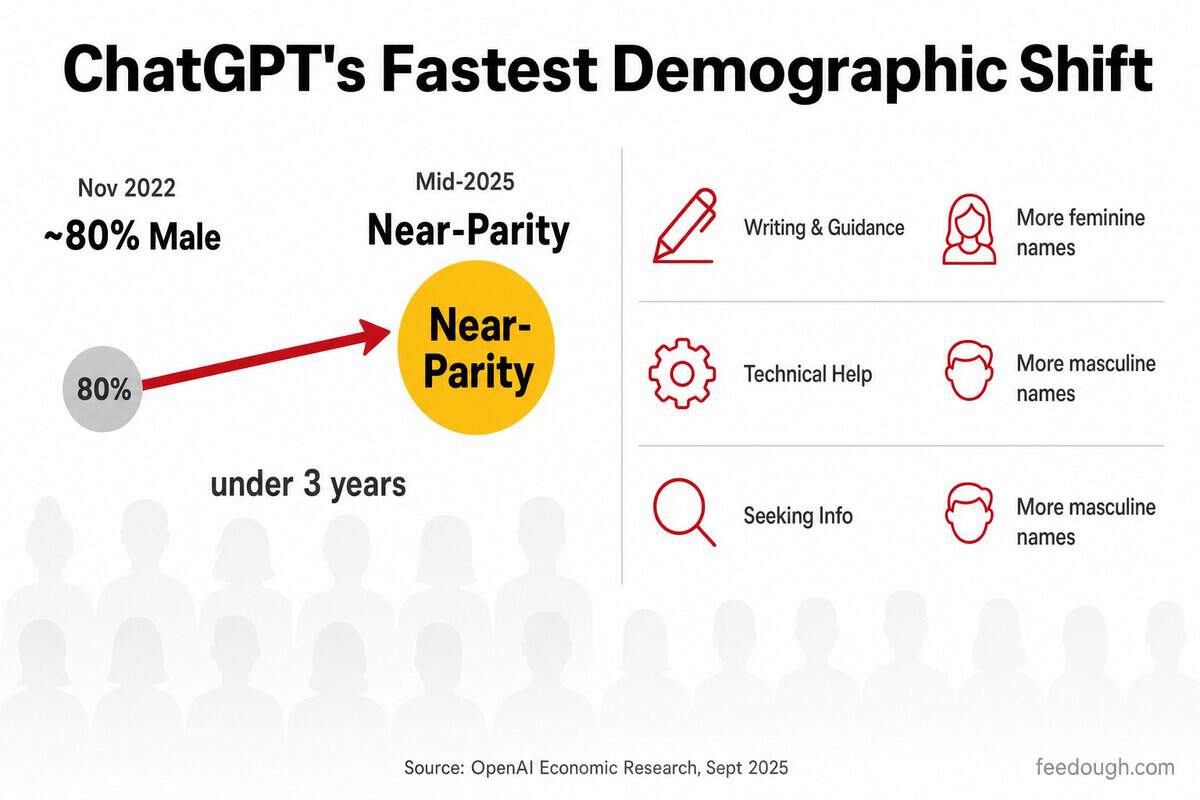
ChatGPT launched with roughly 80% male users in November 2022. By mid-2025, the gender split had reached near-parity. That shift happened in under three years, one of the fastest demographic transitions in consumer technology history.
Usage Category | More Common Among | Example Use Cases |
|---|---|---|
Writing and Practical Guidance | Users with feminine names | Content drafting, daily planning, personal advice |
Technical Help | Users with masculine names | Code debugging, system administration |
Seeking Information | Users with masculine names | Research, fact-checking, analysis |
The behavioral split is not just an academic curiosity. It explains the demographic shift itself. Early ChatGPT users were overwhelmingly technical. That naturally favored a male-skewed user base. As the tool expanded into writing, personal guidance, and creative work, it began pulling in a broader audience. The growth in female users tracks almost directly with OpenAI’s product expansion into non-technical use cases. That pattern matters for what comes next. The remaining gap is not a pipeline problem. It is a use-case problem, and introducing features that serve a wider range of daily activities has proven to be the fastest way to close it.
ChatGPT Geographic Distribution and Usage Patterns Statistics
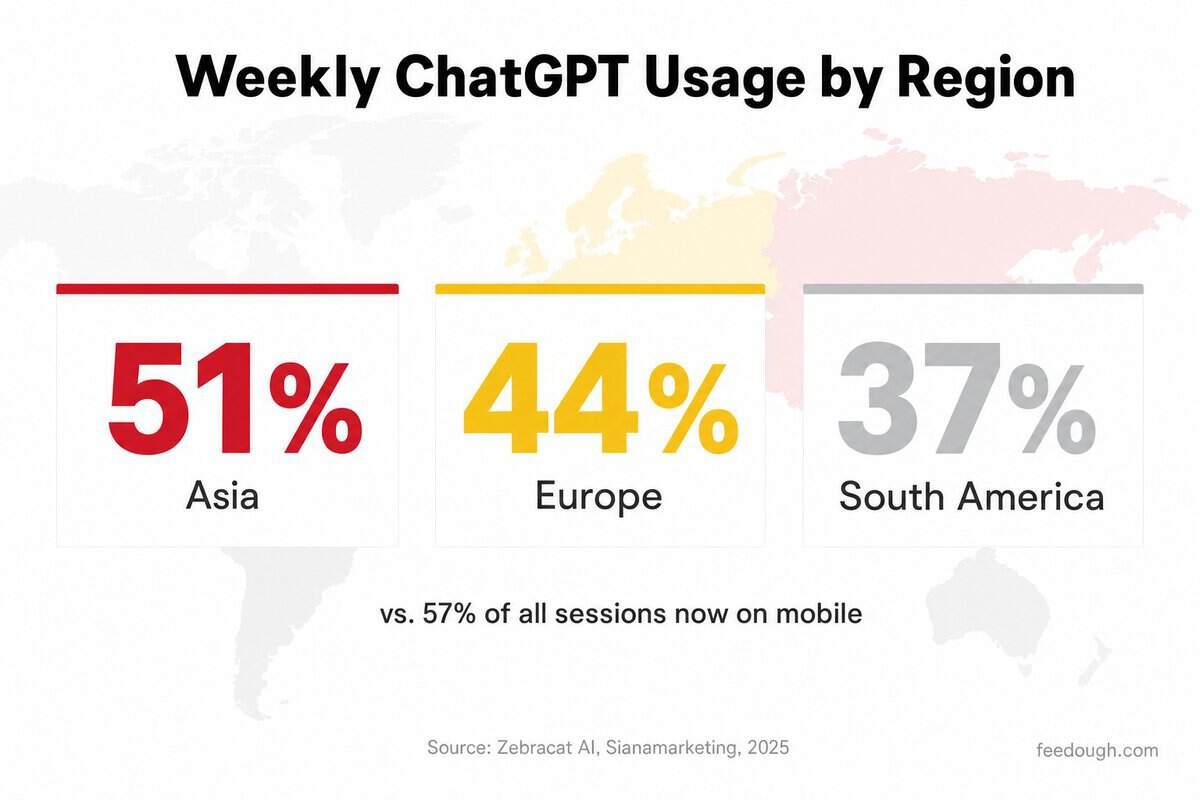
Asia leads the world in weekly ChatGPT usage. 51% of users in Asia report using it weekly, compared to 44% in Europe and 37% in South America. The gap reflects more than just population size. It reveals how deeply the tool has embedded into daily routines across different regions.
Region | Weekly Usage Share | Share of Global Traffic |
|---|---|---|
Asia | 51% | Highest regional penetration |
Europe | 44% | ~14% |
Americas | – | ~25.5% |
South America | 37% | Lower weekly intensity |
Device preference adds another layer. Mobile now accounts for 57% of all global ChatGPT sessions, up from 49% in 2024. That shift matters for understanding geographic patterns. Markets with mobile-first internet access, like India and much of Southeast Asia, naturally show higher engagement rates. The weekly usage gap between Asia and Europe (51% vs 44%) correlates almost perfectly with mobile infrastructure penetration. Europe’s higher desktop share means ChatGPT usage there is more likely to occur during work hours, lowering the ceiling on daily adoption. Australia offers a contrasting signal. The country accounts for roughly 2% of global ChatGPT traffic despite having just 0.33% of the world’s population, making it one of the strongest per-capita adopters outside Asia.
ChatGPT Business and Enterprise Adoption Statistics
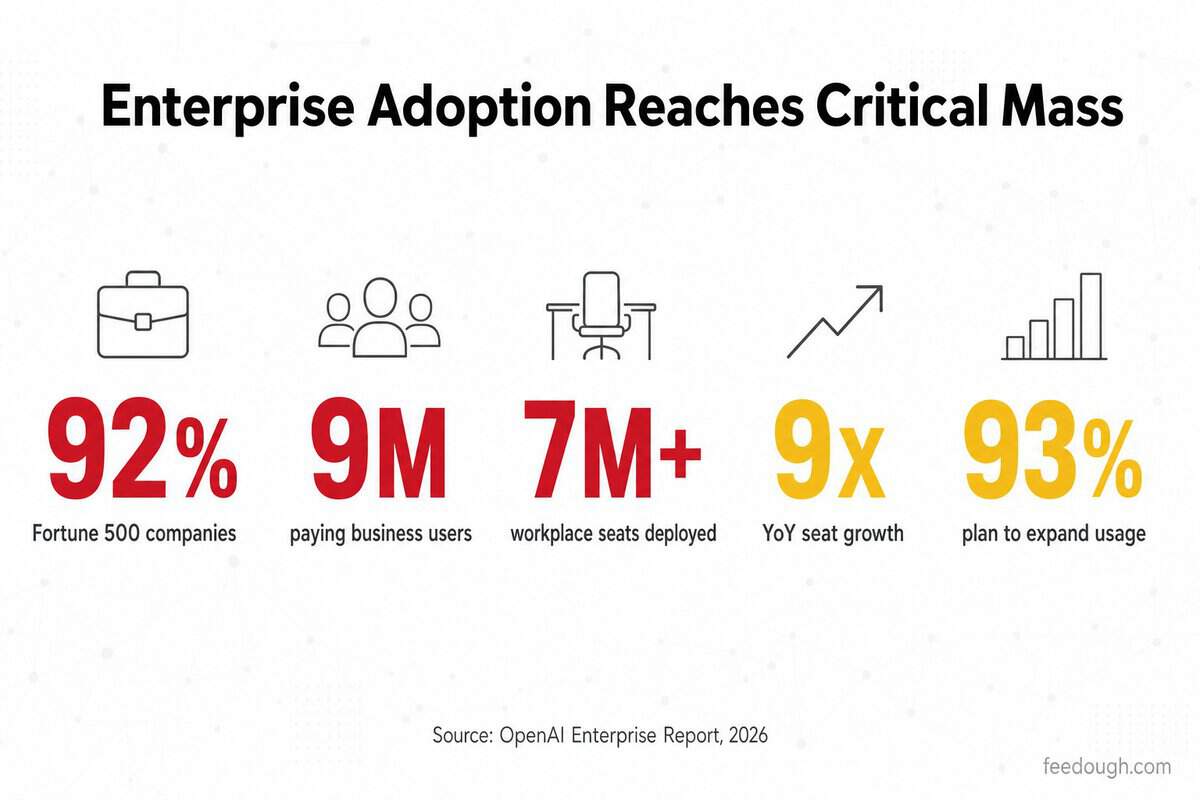
The corporate world did not just experiment with ChatGPT in 2025. It rewired around it. 92% of Fortune 500 companies had integrated ChatGPT into their operations by mid-2025, up from 80% within nine months of the Enterprise product launch in August 2023.
Enterprise Metric | Value | Period |
|---|---|---|
Fortune 500 companies using ChatGPT | 92% | Mid-2025 |
Paying business users | 9 million | February 2026 |
Workplace seats deployed | 7 million+ | December 2025 |
Workplace seat growth (YoY) | ~9x | 2025 vs 2024 |
Business user growth from Sept 2025 | 4x | By February 2026 |
Adoption breadth tells only part of the story. U.S. companies are leading, and the expansion plans suggest the trend has room to run.
- 49% of U.S. companies currently use ChatGPT in some capacity
- 93% of existing enterprise users plan to expand their usage in 2025 Clients include Amgen, Cisco, Booking.com, Morgan Stanley, Target, and Commonwealth Bank
The 93% expansion intent is the number that matters most. It tells you the early adopters are not hitting limits. They are finding more surface area. The 9 million paying business user figure by February 2026, up from a fraction of that in September 2025, confirms that buying centers inside large organizations are not just approving pilots. They are funding deployments. OpenAI opened a direct enterprise sales channel in late 2025, and the acceleration in business user growth tracks almost perfectly with that decision.
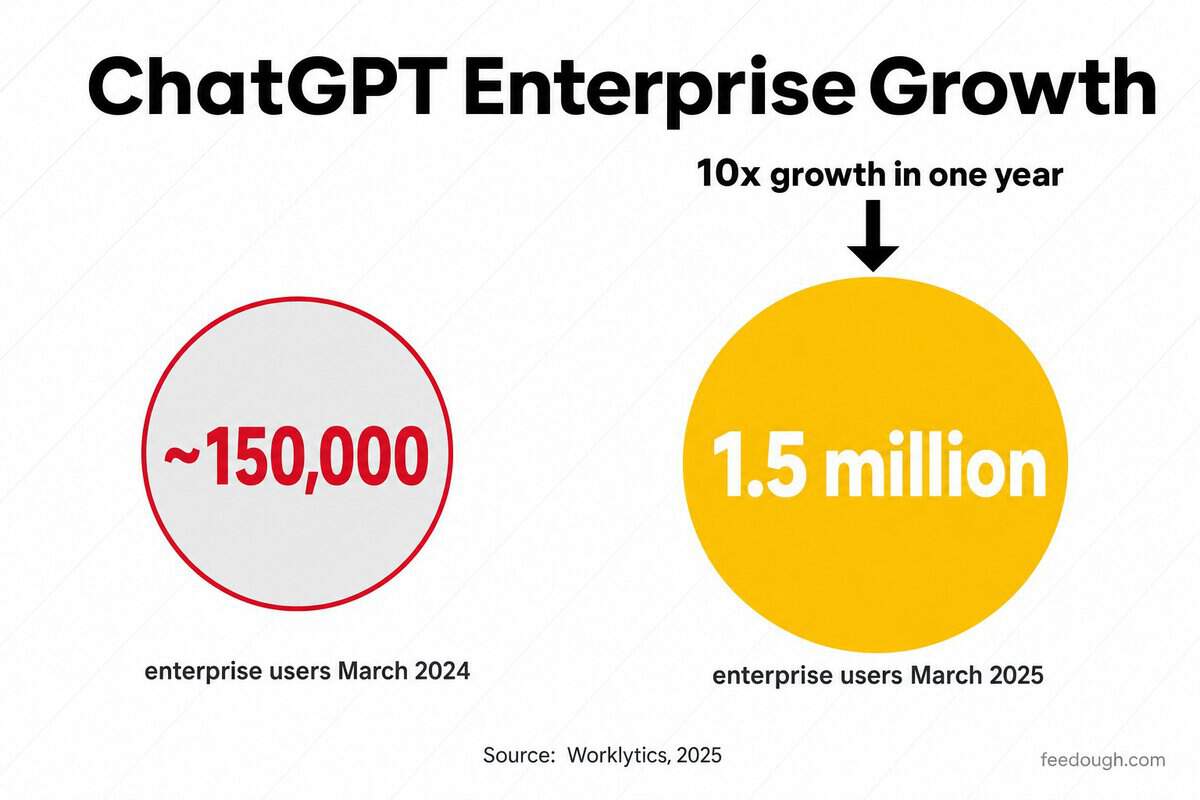
ChatGPT Enterprise Customer Growth Statistics
ChatGPT hit 1.5 million enterprise users by March 2025. That represents roughly 10x growth year-over-year. Most enterprise software products celebrate doubling their user base annually. ChatGPT added enterprise users at a rate with no precedent in corporate software history.
Enterprise Metric | Value | Period |
|---|---|---|
Enterprise users | ~150,000 | March 2024 |
Enterprise users | 1.5 million | March 2025 |
Year-over-year growth | ~10x | 2024 to 2025 |
Enterprise software adoption normally runs through pilot programs, vendor reviews, and security approvals. ChatGPT collapsed that cycle. The 1.5 million figure tells the deeper story. Organizations that adopted ChatGPT did not stop at a handful of seats. They expanded. The jump from roughly 150,000 to 1.5 million enterprise users in a single year means the average deployment grew roughly ten times in size. That kind of expansion velocity is what separates genuine platform shifts from experimental tooling.
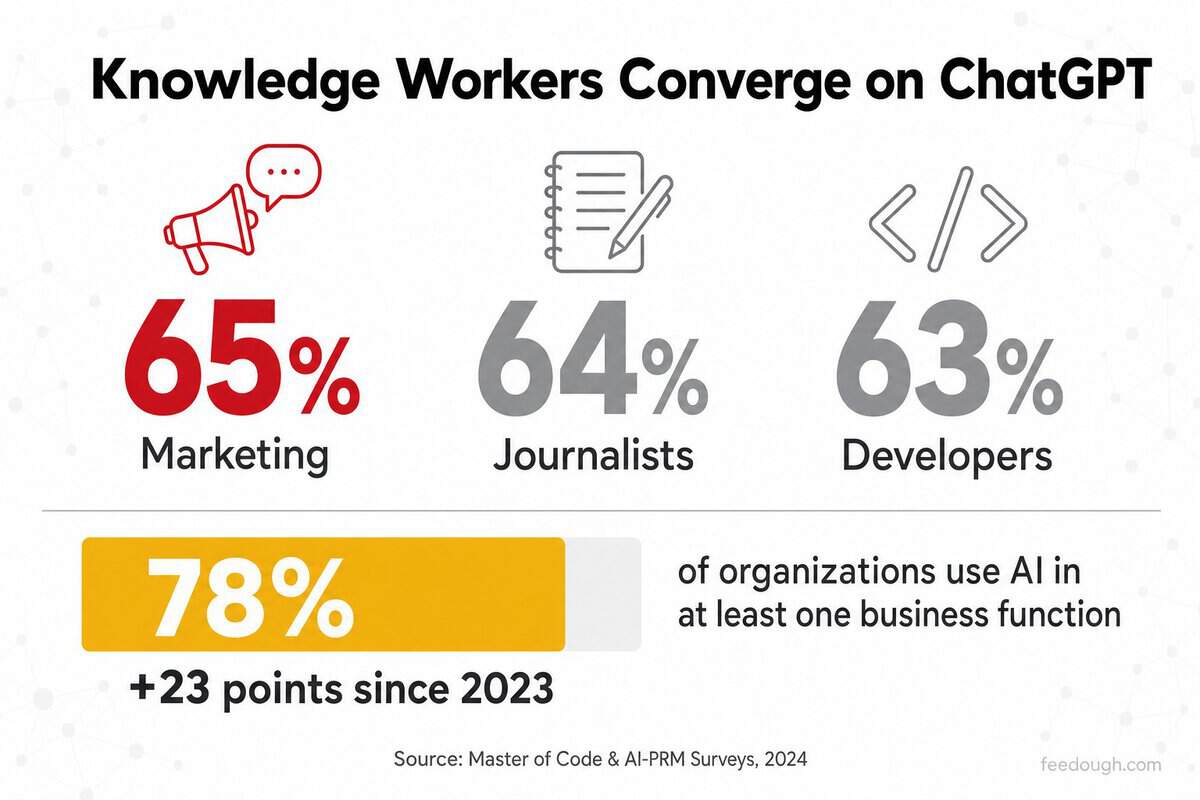
Industry-Specific ChatGPT Adoption Statistics
Marketing professionals, journalists, and software developers all cluster in the same adoption range. 65% of marketing professionals use ChatGPT, followed by 64% of journalists and 63% of software developers. The near-identical figures mask very different use cases.
Profession | Adoption Rate | Primary Use Case |
|---|---|---|
Marketing professionals | 65% (77% overall) | Campaign brainstorming, content creation |
Journalists | 64% | Research, drafting, preliminary fact-checking |
Software developers | 63% | Coding, debugging, documentation |
The marketing figure includes an important nuance. 77% of marketing professionals have adopted the platform in some form, but only 65% describe themselves as active users. That gap between trial and habit is common across all three professions, though narrowest among developers who integrated ChatGPT into existing coding workflows immediately. At the organizational level, 78% of companies now use AI in at least one business function as of mid-2024, a jump of 23 percentage points from the prior year. The industry-specific rates have converged because knowledge workers across sectors discovered the same thing: ChatGPT handles the repetitive parts of their jobs. The divergence is in which parts those are.
Sources
- https://www.businessinsider.com/chatgpt-by-the-numbers-2025-11 (2025-11-01)
- https://en.wikipedia.org/wiki/History_of_Facebook (2025-01-01)
- https://www.cnbc.com/2017/09/25/how-many-users-does-instagram-have-now-800-million.html (2017-09-25)
- https://en.wikipedia.org/wiki/TikTok (2025-01-01)
- https://concept21.agency/blog/chatgpt-statitics (2025-09-01)
- https://textero.io/research/chatgpt-users-statistics-2025 (2025-11-01)
- https://www.saastr.com/openai-crosses-12-billion-arr-the-3-year-sprint-that-redefined-whats-possible-in-scaling-software (2025-07-01)
- https://www.worklytics.co/resources/track-chatgpt-enterprise-usage-by-department-2025-without-instrumentation (2025-09-21)
- https://www.pagetraffic.com/blog/chatgpt-statistics (2026-01-01)
- https://fatjoe.com/blog/chatgpt-stats (2026-05-01)
- https://www.visualcapitalist.com/how-often-people-use-chatgpt-across-21-countries (2023-12-31)
- https://www.christianandtimbers.com/insights/chatgpt-reached-92-of-the-fortune-500-in-24-months (2025-10-30)
- https://www.tmgm.com/en/analysis/market-insight/ai-leader-faces-growth-and-profitability-challenges (2026-04-28)
- https://www.incremys.com/en/resources/blog/chatgpt-statistics (2026-01-01)
- https://www.getpanto.ai/blog/chatgpt-statistics (2026-01-01)
- https://www.techmeme.com/250401/p24 (2025-04-01)
- https://openai.com/index/1-million-businesses-putting-ai-to-work (2025-11-05)
- https://techcrunch.com/2025/08/15/chatgpts-mobile-app-has-generated-2b-to-date-earns-2-91-per-install (2025-08-15)
- https://www.localgold.com/2025/06/05/chatgpt-and-gemini-mobile-app-downloads-worldwide (2025-06-05)
- https://www.apptweak.com/en/reports/most-downloaded-apps-globally-android-ios (2025-12-31)
- https://timesofindia.indiatimes.com/technology/tech-news/2-billion-and-counting-heres-how-much-chatgpts-mobile-app-has-generated-for-openai-to-date/articleshow/123331745.cms (2025-08-16)
- https://openai.com/index/how-people-are-using-chatgpt (2025-09-17)
- https://nerdynav.com/chatgpt-statistics (2025-10-31)
- https://www.limelightdigital.co.uk/chatgpt-users (2026-02-28)
- https://cdn.openai.com/pdf/a253471f-8260-40c6-a2cc-aa93fe9f142e/economic-research-chatgpt-usage-paper.pdf (2025-09-15)
- https://technologychecker.io/technology/openai-chatgpt (2026-03-12)
- https://masterofcode.com/blog/chatgpt-statistics (2026-01-01)
- https://openai.com/index/introducing-chatgpt-enterprise (2023-08-28)
- https://www.aiprm.com/ai-adoption-statistics (2025-01-01)
