
I built a clean-looking stats graphic for a client last month using an AI image generator. It looked great in the thumbnail. Then I zoomed in. Every label was gibberish and half the numbers were invented.
That mistake costs more than a few wasted hours. Articles with infographics earn 178% more inbound links than text-only posts, and I have watched a fabricated stat on a fake one embarrass someone in a client meeting.
I went through every AI infographic tool I could find this year, building the same visual in each one. You want the kind where you can click a word, fix it, and drop your own brand colors in.
After all that, 7 AI tools for infographics in 2026 made the cut.
The Rundown
- Get Spelling Right First Try: ChatGPT, “Generate dense, text-heavy infographics where every heading and tiny chart label renders with zero spelling errors, no retries needed.”
- Iterate On Layouts In Chat: Gemini Nano Banana, “Follow up with ‘recolor the diagram’ or ‘make the background white’ to refine search-grounded data graphics conversationally.”
- Edit In Plain Language: Google Flow, “Type instructions like ‘bigger headings’ to correct a finished infographic instead of regenerating from scratch, with 50 free credits daily.”
- Turn Existing Text Into Visuals: Napkin AI, “Paste written content and get four to six finished diagram options in under 10 seconds, no layout picked upfront.”
- Resize Across Social Platforms: Canva, “Generate 8 to 12 editable infographic layouts per prompt, then push one design into Instagram, LinkedIn and Pinterest sizes with Magic Switch.”
- Keep Every Element Editable: Piktochart, “Click any word or bar to retype it and adjust numbers, so non-designers building data-led reports never work with baked-in text.”
- Apply Brand Kit Automatically: Venngage, “Load your logo, colors and fonts once and every AI-generated branded report picks them up, with click-to-edit charts fed from your own numbers.”
The Best Ai Tools For Infographics

ChatGPT
Best For |
Dense, text-heavy infographics |
Pricing |
Free plan; Plus about $20/mo |
Free Tier |
Roughly 2-3 images per 24 hours |
Export |
PNG only, no transparent backgrounds |
Learning Curve |
Low |
I started with the worst case: a messy pile of notes and no layout idea. I asked ChatGPT for a full infographic. Headings came back readable. So did the tiny labels under each chart. Nothing was garbled, which still surprises me.
My routine stuck after that. I dump the brief, ask for two or three layout concepts, pick one, then request a vertical version in a named style. Editorial and sketchnote both worked. Plain-language edits handle the next pass. Thinking mode, Plus and Pro only, helps with the densest layouts.
The spelling accuracy is the real edge. An independent head-to-head test by Educraft produced zero spelling errors across educational infographics and Greek study notes, while Gemini either slipped or dropped text density.
One Arena leaderboard snapshot compiled by CometAPI puts gpt-image-2 roughly 242 points clear of Nano Banana 2.
That lines up with what I saw. The model plans the layout and checks the text before rendering, so dense stats pages hold together. Paste-and-go tools like Napkin are quicker for a single diagram, but I get more control here on branded layouts.
My main issue is that it is not an editor. Once the PNG lands, you cannot move individual text boxes. Complex prompts can take up to two minutes too. On the densest briefs I still needed one or two retries to fix a repeated phrase.
Other limits worth knowing: no transparent backgrounds, and the knowledge cutoff sits at December 2025, so I paste recent figures into the prompt myself. I usually open the result in Canva or Venngage for final brand tweaks.
If your infographic needs real words in real places, ChatGPT Images 2.0 gets them right on the first try. For that reason it is my pick for best overall AI infographic generator in 2026.

Gemini Nano Banana
Best for | Data diagrams and infographics from a prompt, edited in chat |
Strength | Legible text and search-grounded data |
Watch out | Vague prompts give cluttered layouts; occasional typos |
Access | Gemini app, free tier limited and watermarked |
2026 status | Google’s default image model since Feb 2026 |
I picked this up right after Nano Banana 2 became Google’s default image model in February 2026. Ars Technica’s write-up matched Google’s promises, and what I saw: Pro-like text accuracy at Flash speed, up to 4K. Numbers and labels actually stay readable, which is where most image models fall apart.
The chat loop is the real workflow. I ask for an outline, then a layout and style spec, then follow up with “recolor the diagram” or “make the background white”. No dragging shapes. Google’s Search grounding is supposed to keep the data current instead of stale recall.
One thing you should know. My first lazy one-line prompt produced a cluttered mess of generic clip-art. Give it a style guide and build it in two steps instead. Short sentences in, clean diagram out.
It does not always win. In Decrypt’s six-category head-to-head, Nano Banana 2 took three, including lettering density and a factual-accuracy timeline, and the models ended basically tied. If your workflow already lives in Canva or Piktochart, you are swapping shape-dragging for prompt-writing. I’d choose this when the deliverable is a diagram heavy on words and data.

Google Flow
Pricing | Free plan, plus Google AI Plus at $4.99/mo, AI Pro at $19.99/mo, AI Ultra at $99.99/mo |
Free plan | 50 Flow credits per day |
Best For | Bespoke infographics refined with plain-language edits |
Ease of Use | Quick once you think in edits instead of prompts |
Supported Models | Nano Banana 2 (default), Nano Banana Pro |
The first thing that got me was typing an edit instead of regenerating. I asked for bigger headings and a two-column legend, and the layout came back corrected. That is the actual product here, not a slogan.
Text quality is what separates this from most image tools. Nano Banana 2 was the model loaded by default every time I opened Flow, and its rendering of small copy is genuinely better. Labels, captions, footnotes, they came back readable. For anything with words on it, that matters more than the artwork.
Google’s labs leadership clearly agrees about the use case. Josh Woodward told CNBC that Nano Banana Pro is “incredible at infographics” and can handle up to 14 images at once while keeping characters consistent.
Speed was fine. Complex prompts came back in roughly 10 to 15 seconds in my runs. Not instant, but I never sat waiting long enough to lose my train of thought.
The free tier is where the friction lives. Fifty credits a day goes quickly, and a post on r/Bard described models ignoring prompts and image references, with faces getting worse. I saw smaller versions of that on character-heavy work. If you need consistent characters across a whole campaign, the paid tier is the upgrade you want.
Against a template app like Napkin AI, the choice is speed versus control. Napkin arranges your text into ready-made icon layouts fast. Flow builds something bespoke and lets me keep editing in plain language. For polish, I would take Flow.

Napkin AI
Best for | Turning existing written content into diagrams |
Free plan | $0, 500 credits/week, PNG and PDF export, Napkin watermark |
Paid plans | Plus $9/month, Pro $22/month per person, 25% off annual |
What it does best | Structured text to a finished diagram in seconds |
Main drawback | Abstract input produces generic visuals needing edits |
The thing that separates Napkin from the template-first tools here is the starting point. You don’t pick a layout first. You paste your text, and the layout comes to you.
I highlighted a block, clicked the spark icon, and got four to six visual options in a few seconds. The results were diagrams, timelines and comparison cards, not decorated paragraphs. A 28-day paid test fed it a roughly 150-word process description and got back a five-node infographic. Mine behaved similarly.
Speed is the real sell. An 8-month user’s timed test clocked paste to finished graphic under 10 seconds. That lines up with what I saw. The free plan also lets you download files, which not every free tier in this category allows. The catch is a small but visible watermark.
My main issue was input quality. Clean steps or a comparison list come out sharp. Vague prompts like “market opportunity” give me something generic that needs cleanup. Other 2026 reviewers keep hitting the same wall, so treat Napkin as a fast draftsman, not a mind reader.
Watch the credits too. Plus caps at 10,000 monthly credits against Pro’s 30,000, and Plus top-up rules aren’t publicly documented. I’d recommend Plus at $9 as the floor for anything client-facing, since it drops the watermark and unlocks PPT and SVG export.
If you already have the words and just need a visual, I’d try it first. If you need a branded report or a full deck, look elsewhere in this list.
Canva
Pricing | Pro $15/month with 500 AI credits |
Free plan | Yes, roughly 50 AI credits per month |
Best For | Social-media infographics across several platforms |
Ease of Use | Magic Switch resizing for Instagram, LinkedIn, Pinterest |
Learning Curve | Low, first layouts land within minutes |
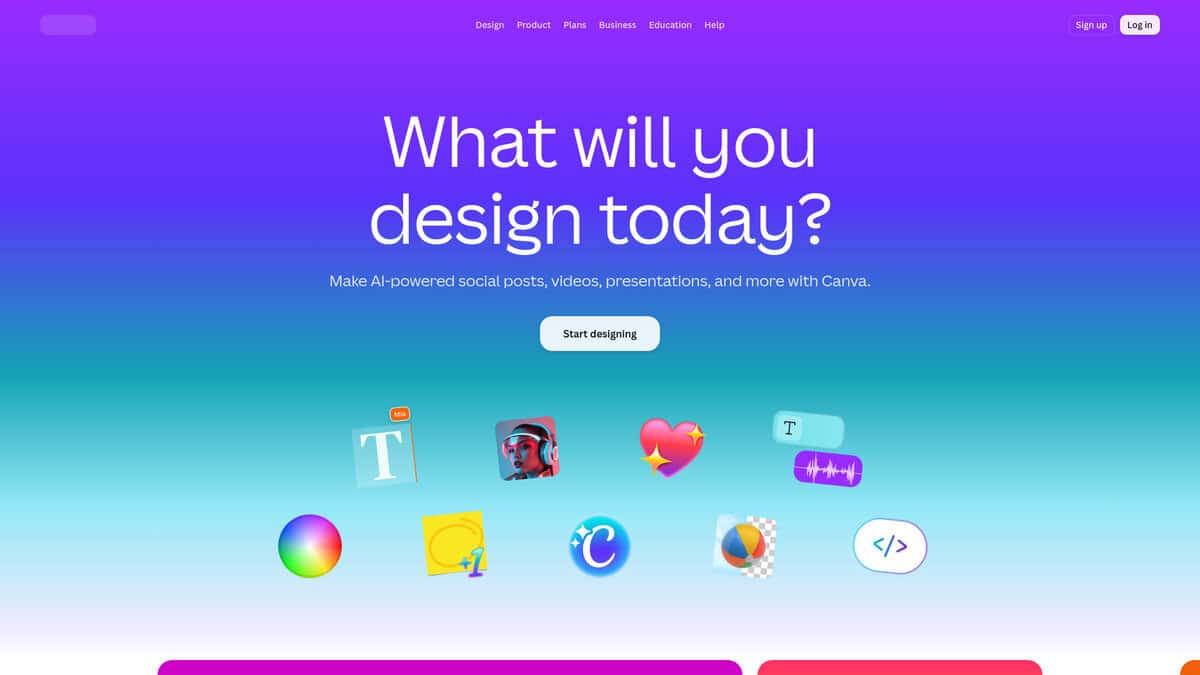
I typed in a prompt for a Friday tips carousel in teal and coral. Twelve editable layouts came back in under a minute. Sawankr’s 2026 Magic Studio guide puts typical Magic Design output at 8 to 12 layouts per prompt, which matched what I got.
What really sold me was the canvas. I dropped a bar chart, a pictogram, and a pie chart beside my copy, then used Magic Switch to push the same design into Instagram, LinkedIn, and Pinterest sizes. Piktochart and Venngage are chart-first and report-shaped. They never quite fit that loop.
The pricing is the catch. Fast.io’s 2026 review puts Pro at $15/month and says the free tier gets only about 50 AI credits. Every Magic feature shares that pool, so heavy Dream Lab use starves Magic Design.
There is a sameness problem too. Fast.io found AI output converging on Canva’s most popular layouts. If you skip the recolor and rewrite step, your post looks like everyone else’s. I also noticed Magic Expand behaving inconsistently across runs.
For on-brand, multi-platform infographics on a deadline, this is the one I’d pick. Just budget for Pro if you post daily.

Piktochart
Best for | Data-led infographics built by non-designers |
Starting price | Pro from $10/mo billed yearly, $15 monthly |
Free plan | 60 AI credits/month, 2 watermarked PNGs |
Standout feature | Fully editable draft from a prompt or document |
Main limitation | AI layouts feel generic, chart labels can overlap |
The clearest reason to pick this over the image generators elsewhere in this list: nothing is baked in. I clicked a headline and retyped it. I clicked a bar and changed the number. Every chart, icon and label stayed editable.
That is my entire test, and you can run it in ten seconds. Click a word, change it, and you have a real infographic generator. If the text is frozen into pixels, you have an image generator, and the numbers were probably invented by the model.
I fed it a text-heavy report and had a sensible draft fast. You can also paste notes, a data summary, a prompt, or upload a document outright. The first pass covered the structure I expected, so I spent my time refining instead of rebuilding.
It is not perfect. Some generated chart labels overlapped, so I nudged them by hand. An independent tester who used it for six months on YouTube said the layouts can feel a bit generic and the tool gets restrictive if you want full creative freedom. Fair. For reports, statistics and educational material he found it strong, and so did I.
Independent reviews land in the same place. It holds a 4.4 out of 5 on Trustpilot across 228 reviews, and the loudest complaint is the free tier, not the AI.
That free tier is where the friction starts. Piktochart’s own pricing page lists Pro at $10 a month billed yearly, $15 monthly, and the free plan at 60 AI credits plus two watermarked PNG downloads. Those credits run out quickly. Expect to upgrade or live with the watermark.
I would point marketers, educators, consultants and small teams turning reports or data into infographics here. If you want abstract, freeform art, use an image generator instead.

Venngage
Best for | Branded content and statistical infographics |
Free plan | 5 AI generations per day, 5 designs total |
Brand Kit access | Business tier, $24/mo per user billed annually |
Export options | PDF, PNG, PPT, HTML, private link |
Standout feature | AI Designer chatbot for conversational editing |
The first thing I tested was the plain text-to-infographic flow. I typed a rough prompt, and the AI picked a layout I could actually work with. Uploading a Word doc or CSV works too, which saved me from reformatting numbers by hand.
What stood out was the branding. I dropped in a logo, colors and fonts once, and the AI Designer pulled them in automatically on every new generation. An independent test of this workflow clocked the brand kit setup at roughly 5 minutes from blank to branded. My experience matched that. The tool also checks color contrast as you go, which matters if you publish for accessibility.
Now the catch. That Brand Kit sits on the Business tier at $24 per user per month, billed annually. The free plan gives you 5 AI generations a day and 5 designs total, public sharing only. Premium at $10 adds unlimited designs and PNG export, but still no Brand Kit. If branded output is your whole reason for trying Venngage, plan for Business pricing.
Charts were my favorite part. Bar, column, pie, funnel, word cloud, heat map, all click-to-edit with your own numbers. I fed mine from a spreadsheet and the edits took seconds. In my testing Venngage was strongest when I arrived with my message and numbers ready. Vague input gives you a vague graphic.
Speed is not the story. In my testing the AI was not as fast as Piktochart, but the editor depth made up for it. The editor is deep, so simple social visuals take longer here than they would in Canva.
My main issue is the learning curve. The templates lean commercial and professional rather than playful, which I liked, but beginners will spend time exploring. If you want polished, on-brand reports and data stories, I’d recommend it. If you want fast, casual graphics, look elsewhere.